jma_logo Welcome to TCC wmo_logo
Home
World Climate
Climate System Monitoring
El Niño Monitoring
NWP Model Prediction
Global Warming
Climate in Japan
Training Module
Press release
Links
HOME >Climate System Monitoring > Seasonal Highlights on the Climate System

Seasonal Highlights on the Climate System

'Seasonal Highlights on the Climate System' has been issued since March 2007 as a seasonal bulletin focusing on the seasonal highlights of the monitoring results. For monthly information, please refer to 'Monthly Highlights on the Climate System.'

Notice: Products have been upgraded from PDF to HTML format starting from the issue of spring 2025 for improved accessibility.


Highlights in Summer (June 2025 - August 2025)

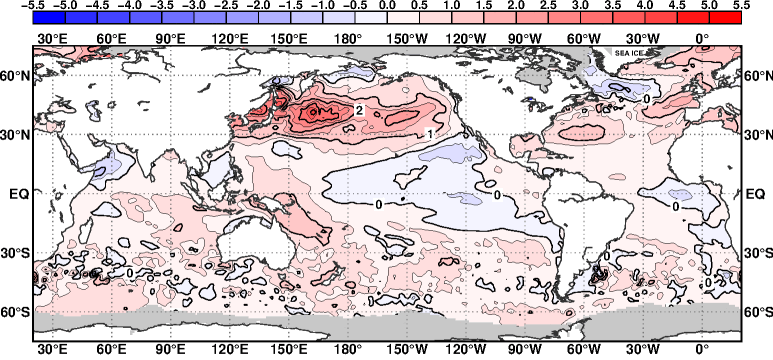
- In the equatorial Pacific, remarkably positive SST anomalies were dominant in the western part, while weak negative SST anomalies were observed from 165°E to 110°W (Fig. S3). This was an anomaly distribution similar to that seen during a La NiƱa event, although it did not meet the criteria. In the northwestern Pacific, positive SST anomalies were significant in the tropics and the mid-latitudes except for around the northern Mariana Islands where weak SST anomalies were seen. In the Indian Ocean, remarkably positive SST anomalies were observed from the central to the eastern part of the tropics, while significantly negative SST anomalies were dominant in the Arabian Sea.
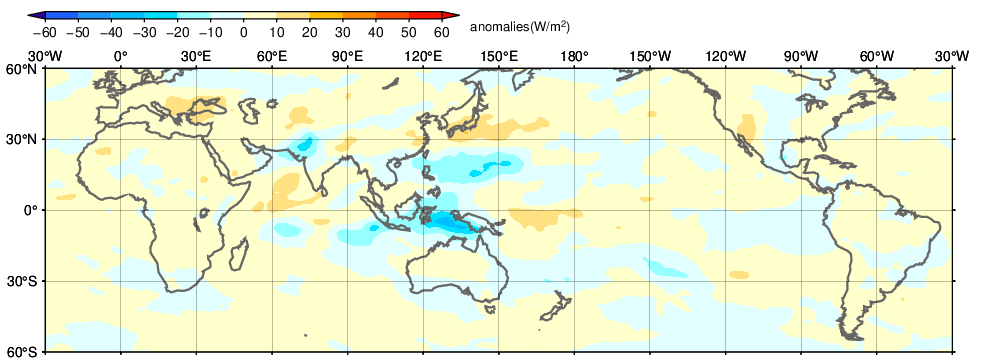
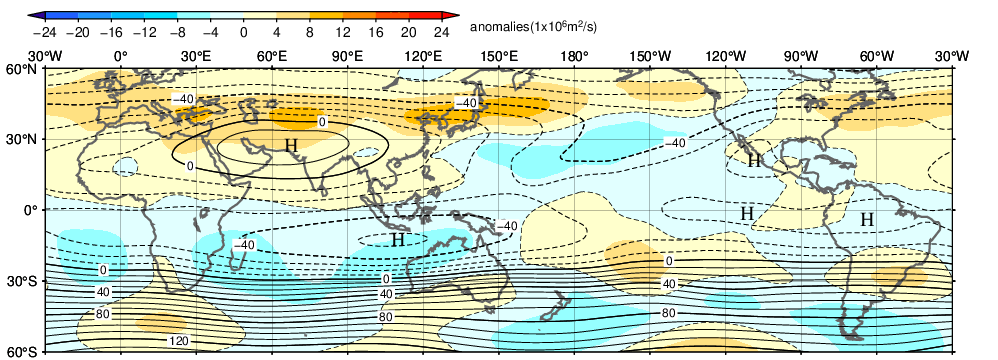
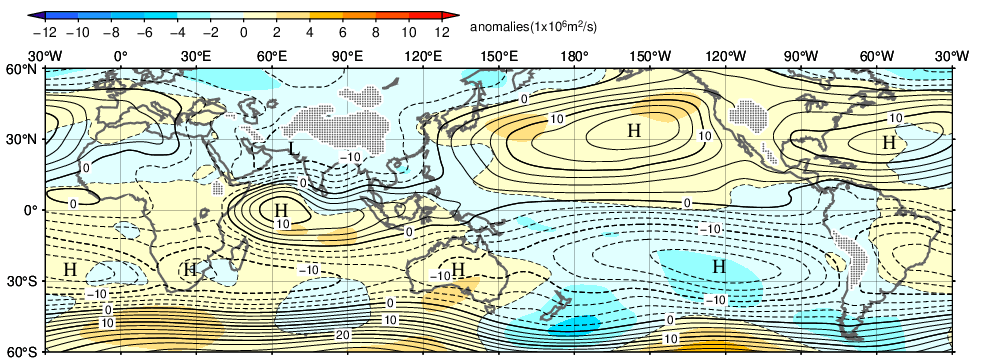
- The global distribution of large-scale divergence/convergence areas in the upper troposphere showed wave number 1 pattern and the center of divergence was located around the Maritime Continent. Convective activities were especially enhanced around the Indonesia and the east of the Philippines, and they were also enhanced over the northwestern India (Fig. S4). Active convection accompanied with the Asian Monsoon persisted except for from the end of July to the beginning of August. In the tropical upper (Fig. S5) and lower (Fig. S6) troposphere, cyclonic and anti-cyclonic circulation anomalies straddling the equator were seen over the Pacific, respectively, and they were reversed over other areas. Cyclonic anomalies were significant over the subtropical North Pacific in the upper troposphere, which meant the deeper-than-normal mid-Pacific trough.
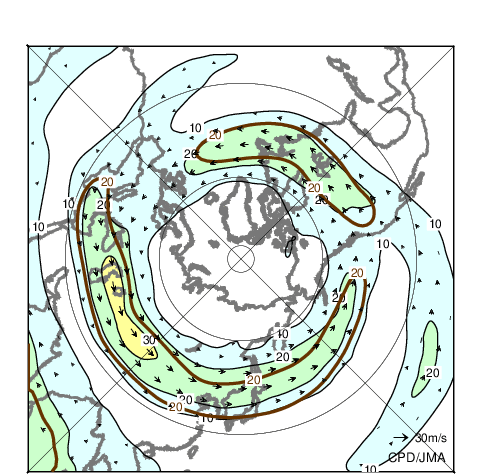
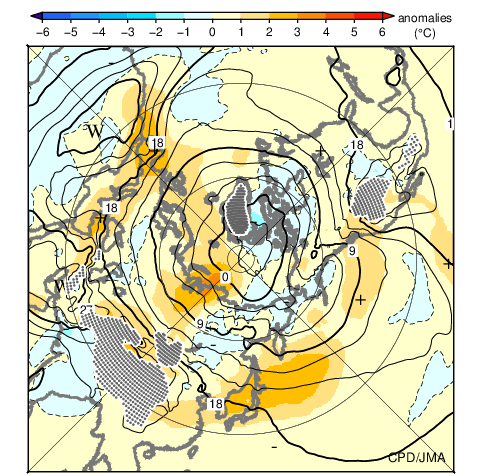
- In the Northern Hemisphere, remarkably stronger-than-normal subtropical jet stream shifted significantly northward from its normal position (Fig. S8) and temperatures were significantly above normal and these anomalies exceeded the three times of the standard deviation. In the upper troposphere, zonally elongated anti-cyclonic circulation anomalies were seen over mid-latitude Eurasia, corresponding to the intensified northward extension of the Tibetan high. The Tibetan high also strongly extended to around Japan. The propagation of quasi-stationary Rossby wave packet along the subtropical jet stream often strengthened anti-cyclonic anomalies around Japan.
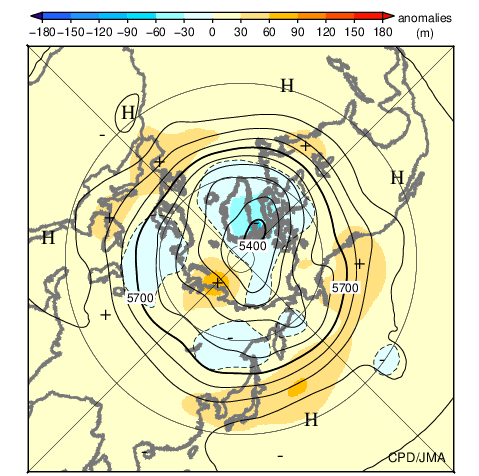
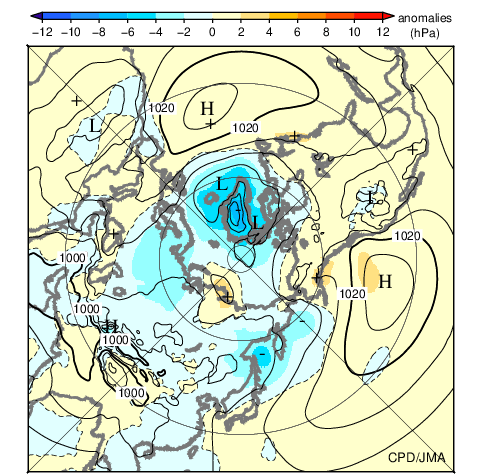
- In the 500-hPa height field (Fig. S7), the polar vortex was located around the Baffin Bay. Negative anomalies were seen around Greenland, while positive anomalies were dominant around the Taimyr Peninsula. Positive anomalies were dominant almost in the mid-latitudes, and they exceeded the three times of the standard deviation around Turkish, the Tibetan Plateau and from eastern China to the east of Japan. Sea level pressure anomalies were positive in the Pacific and the Atlantic which meant stronger-than-normal subtropical highs, while significantly negative in the Sea of Okhotsk (Fig. S9). The subtropical high in the northwestern Pacific strongly extended to Japan and it was often more strengthened accompanied with active convection around the Philippines. This phenomenon is one of typical mechanisms which bring extreme heatwave in Japan and well known as the Pacific-Japan tele-connection pattern.
- The characteristics of climate in Japan in summer were remarkably above normal temperature, remarkably above normal sunshine durations, and below normal precipitation (Fig. S1). The monthly anomaly of the average surface temperature over Japan was +2.36°C which was the highest record for summer since 1898. The statistics of regional average in Japan showed significantly above normal temperatures and significantly above normal sunshine durations in northern/eastern/western Japan, and significantly below normal precipitations in the Pacific side of northern and eastern Japan.

Supplemental information

- Climate Anomaly Table over Japan

Fig.S1 Seasonal climate anomaly/ratio over Japan (June 2025 - August 2025)
Top: temperature anomalies (degree C)
Middle: precipitation ratio (%)
Bottom: sunshine duration ratio (%)
The base period for the normal is 1991-2020.


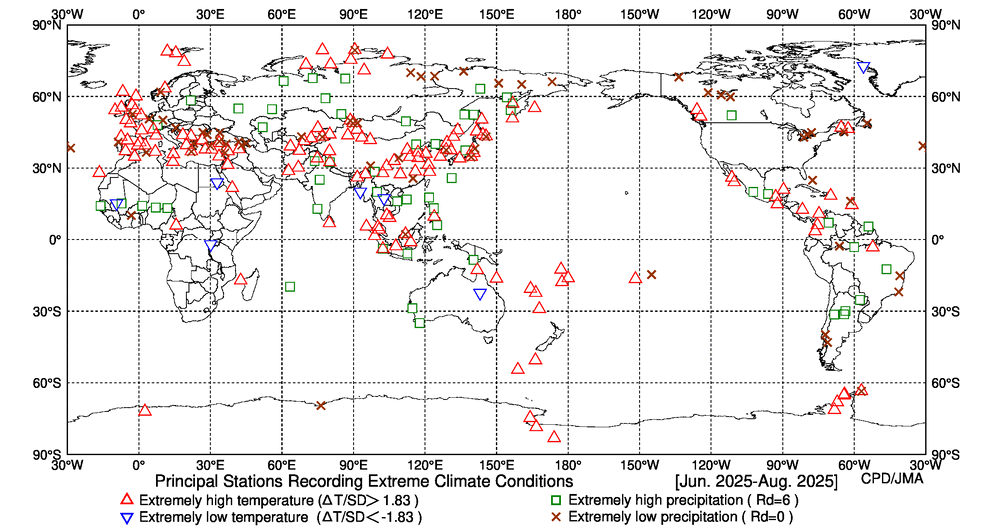
Fig.S2 Distribution of extreme climate stations (June 2025 - August 2025)


Fig.S3 Three-month mean sea surface temperature anomaly (June 2025 - August 2025)
The contour interval is 0.5 degree C. The base period for the normal is 1991-2020. Maximum coverage with sea ice is shaded in gray.


Fig.S4 Three-month mean Outgoing Longwave Radiation (OLR) anomaly (June 2025 - August 2025)
The shading interval is 10 W/m2. The base period for the normal is 1991-2020. Original data (CPC Blended OLR) are provided by NOAA.


Fig.S5 Three-month mean 200-hPa stream function and anomaly (June 2025 - August 2025)
The contour interval is 10x106 m2/s. The base period for the normal is 1991-2020.


Fig.S6 Three-month mean 850-hPa stream function and anomaly (June 2025 - August 2025)
The contour interval is 2.5x10⁶ m2/s. The base period for the normal is 1991-2020.


Fig.S7 Three-month mean 500-hPa height and anomaly in the Northern Hemisphere (June 2025 - August 2025)
The contours show 500-hPa height at intervals of 60 m. The shading indicates its anomalies. The base period for the normal is 1991-2020.

Fig.S8 Three-month mean 200-hPa wind speed and vectors in the Northern Hemisphere (June 2025 - August 2025)
The black lines show wind speed at intervals of 10 m/s. The brown lines show its normal at intervals of 20 m/s. The base period for the normal is 1991-2020.

Fig.S9 Three-month mean sea level pressure and anomaly in the Northern Hemisphere (June 2025 - August 2025)
The contours show sea level pressure at intervals of 4 hPa. The shading indicates its anomalies. The base period for the normal is 1991-2020.

Fig.S10 Three-month mean 850-hPa temperature and anomaly in the Northern Hemisphere (June 2025 - August 2025)
The contours show 850-hPa temperature at intervals of 3 degree C. The shading indicates its anomalies. The base period for the normal is 1991-2020.

Back Number


The descriptions from May-2011 to April-2021 issue are based on the former climatological normal (1981-2010 average).
In the descriptions until April-2011 issue, 1979-2004 average is used as climatological normal unless otherwise stated.
The descriptions until January-2014 issue are based on the JRA-25/JCDAS datasets.
The descriptions from February-2014 to April-2023 issue are based on the JRA-55 reanalysis.

Figures and Tables

Notice: Products based on JRA-3Q were updated to those with improved quality in terms of tropical cyclone analysis. OLR-related products from January 1991 are based on NOAA CPC Blended OLR (CBO).

Notice: Figures of 'Atmospheric Circulation', 'Time Cross Section', and 'Indices' have been revised with improved quality data regarding tropical cyclone analysis. (18 June 2024)

Notice: Depending on the availability of NOAA CPC Blended OLR (CBO) data, updates may be delayed or figures may be filled with gray indicating data missing.


If you would like to subscribe to Seasonal Highlights on the Climate System, please send an email to

with your name, affiliation, country and email address.
page top

Tokyo Climate Center, Climate Prediction Division.
Copyright(C) 2002. Japan Meteorological Agency. - Legal Notice -