Umkehr Observation
Umkehr observation
Umkehr observation is conducted to determine vertical ozone distribution. During temporally continuous observation of scattered solar light from the zenith when the sun is located between 60° and 90° of its zenith angles, the peak intensity ratio of ultraviolet rays easily absorbed by ozone to those less easily absorbed (ratio: approx. 310 - 326 nm) is observed. The peak shape of this ratio depends on ozone vertical distribution.
Umkehr is German for "reversal," in which the ratio of two ultraviolet rays' intensities rise as the solar zenith angle increases in continuous observation but decrease at a certain solar zenith angle. The line of the ratio in a graph is called an Umkehr curve. In such observation, the whole atmosphere is divided into 10 layers, and the amount of ozone (m atm-cm) in each layer (i.e., vertical distribution) is calculated from this curve.
Observation results
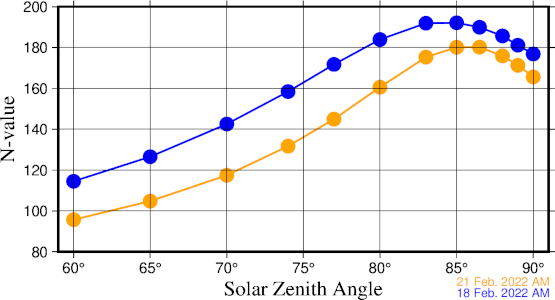
Umkehr observation is conducted between solar zenith angles of 60 to 90° in the morning and afternoon. Only cases with no clouds at the zenith are analyzed. The shape of the Umkehr curve and the angle at which the curve inverts depend on ozone amounts and vertical distribution. When total ozone is high, inversion occurs at a lower angle and vice versa (see figure).
Quality-checked results are published in the Annual Report on Atmospheric and Marine Environment Monitoring Data.
Umkehr observation results
The horizontal axis is the solar zenith angle, and the vertical axis is the intensity ratio (N-value) of ultraviolet rays that are easily absorbed by ozone to those that are not. The blue Umkehr curve is for days with high total ozone, and the orange one is for days with low values. The blue one inverts (i.e., the ultraviolet intensity ratio changes from increase to decrease) at around 85° of the solar zenith, and the orange one inverts at around 86.5°.
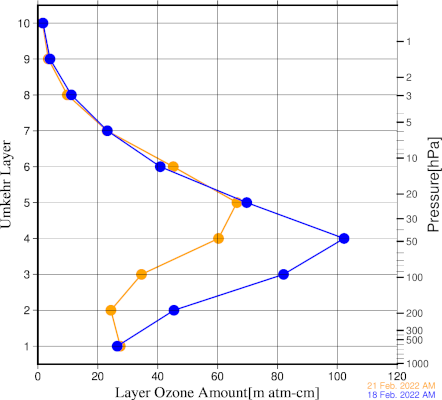
Vertical ozone distribution from ozone Umkehr observation
The left vertical axis is the vertical layer in Umkehr observation, the one on the right is approximate atmospheric pressure, and the horizontal axis is the ozone amount in each layer. Blue represents vertical ozone distribution calculated from Umkehr observation on days with high total ozone, and orange represents that for days with low total ozone. Blue shows more ozone from layers 2 to 4.