Total Ozone Observation
Total ozone
This is the total amount of ozone in an atmospheric column from the earth's surface to the top of the atmosphere, as indicated by the thickness of separated ozone at standard pressure and temperature in units of m atm-cm or DU (Dobson units). A value of 300 m atm-cm is equivalent to a thickness of 3 mm at standard pressure (1 atm) and temperature (0°C). The Japan Meteorological Agency (JMA) observes total ozone using a Brewer spectrophotometer.
Observation types
- Observation using direct sunlight
- This type is the most accurate, allowing theoretical calculation of total ozone. However, values cannot be observed when direct sunlight is blocked by clouds.
- Observation using solar scattered light from the zenith sky
- This type of observation is conducted when there is no direct sunlight, such as in cloudy conditions. Total ozone determination is based on an empirical formula derived from comparison with direct sunlight observation.
- Observation using moonlight
- This type of observation is conducted during the polar night in high-latitude areas such as Antarctica. Since moonlight is weak, there are limitations on the moon phase and the atmospheric path length of moonlight.
Observation results
Total ozone observation is conducted daily, and the results are reported to meteorological agencies around the world via the Global Telecommunication System (GTS) of the World Meteorological Organization (WMO). Quality-checked data are published in JMA's Annual Report on Atmospheric and Marine Environment Monitoring Data as well as on the World Ozone and Ultraviolet Data Centre (WOUDC) website.
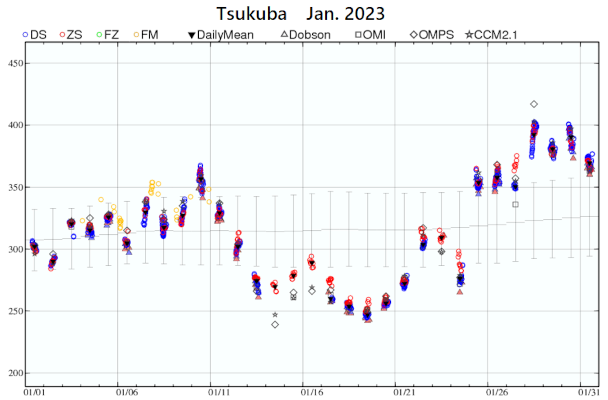
Daily total ozone data from the Aerological Observatory at Tsukuba
The horizontal axis is time (scaled daily), and the vertical axis is total ozone (m atm-cm). Blue, red and yellow dots indicate total ozone observed using a Brewer spectrophotometer, black indicates total ozone observed or estimated via other methods, and grey lines indicate daily reference values and related ±1 standard deviation. References are averages from 1994 to 2008.