IntroductionThe Japan Meteorological Agency (JMA) conducted a survey on climate risk management in relation to electrical appliance sales in collaboration with an association of major retailers.Climate risk management (CRM) involves understanding and taking effective measures against anomalous conditions such as heat waves and cold spells. It involves (1) recognizing climate risks (awareness), (2) quantitative evaluation of such risks (assessment), and (3) related response based on climate information (adaptation). 1. CRM Awareness Electrical appliance retailers tend to sell seasonal products (such as air conditioners and kerosene fan heaters) at specific times of year. It is trivial that sales of such items increase in early summer and late autumn in line with demand. 2. CRM Assessment Analysis showed a quantitative relationship between atmospheric temperature and sales of appliances such as air conditioners and kerosene fan heaters, along with particular characteristics relating to items and regions. 3. CRM Adaptation Retailers can optimize sales based on temperature forecasts up to two weeks ahead based on the above relationship. Quantitative relationship between temperature and sales – climate risk assessmentThe quantitative relationships between atmospheric temperature and sales of air conditioners in Kanagawa Prefecture and kerosene fan heaters in Osaka Prefecture were examined. Seven-day averages for temperature and sales volumes were considered in order to eliminate the effects of day-to-day sales variations, and the results were presented in time-series charts and scatter diagrams.Air conditionersFigure 1 shows a time-series representation of air conditioner sales, average temperatures and related normals in Kanagawa Prefecture for April to August 2013.From June to August, sales increase as the average temperature rises. However, the relationship is non-linear; temperatures in August are higher than in July, but sales are not. Here, focus is placed on the excess from the normal temperature. In July, sales increase by a factor of around 1.5 when the average temperature rises to 2°C above the normal. 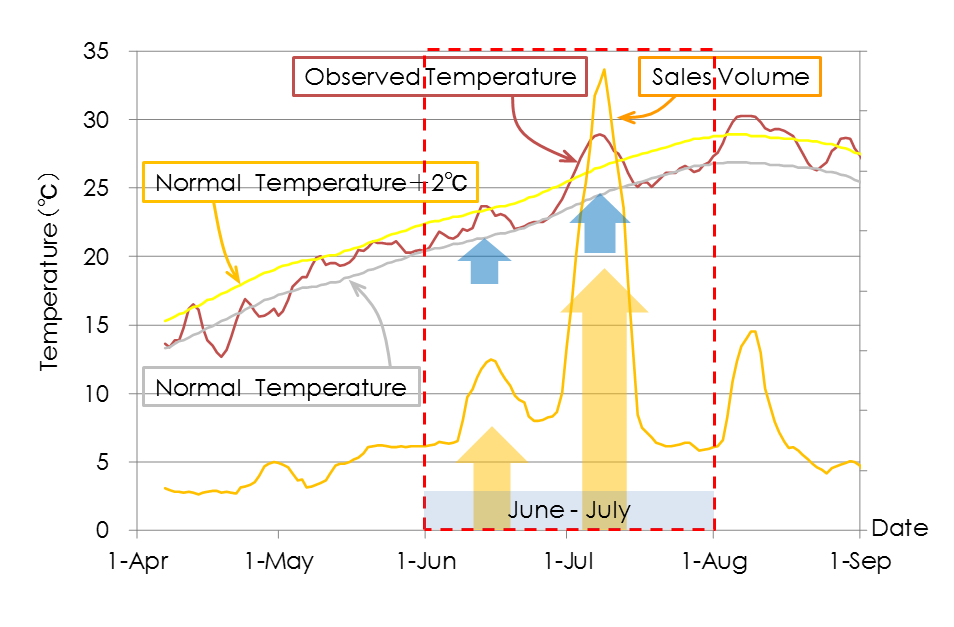
Figure 1 Air conditioner sales, average temperatures and temperature normals for April to August 2013 in Kanagawa Prefecture Kerosene fan heaters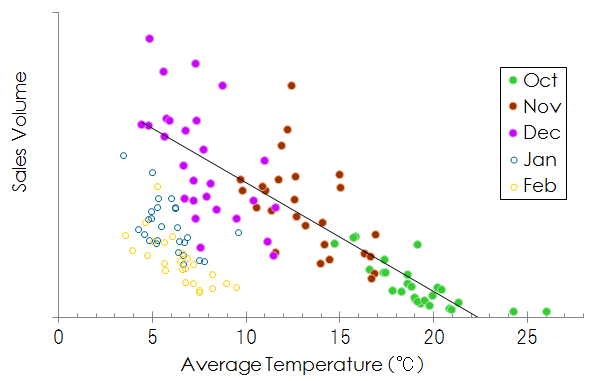
Figure 2 Average temperatures (horizontal axis) and kerosene fan heater sales (vertical axis) in Osaka Prefecture for October to February of 2011 to 2016 Figure 2 shows that kerosene heater sales for Osaka Prefecture from October to February of 2011 to 2016 increase as the temperature falls. Sales decreased from December onward despite minimum temperatures in January and February.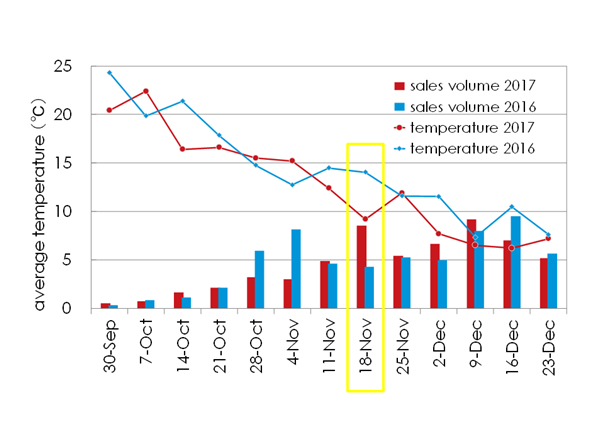
Figure 3 Kerosene fan heater sales and average temperatures for October to December of 2016 and 2017 in Osaka Prefecture. The horizontal axis represents the first day of seven-day periods, and the vertical axis represents average temperatures. Figure 3 shows kerosene fan heater sales and average temperatures from October to December of 2016 and 2017 in Osaka Prefecture. Changes in sales follow temperature, which differs from year to year. In relation to the week indicated by the yellow outline, temperatures fell sharply (red line) in the seven-day period from November 18 2017 and sales increased rapidly (red bar).Sales response based on climate information – climate risk adaptationTemperature-related response regarding sales of air conditioners and kerosene fan heaters requires temperature forecasts rather than historical data. In this regard, two-week temperature forecasts are provided by JMA with brief guidance.Using objective temperature data, chain store management can increase the accuracy and persuasiveness of instructions to individual stores and departments in relation to:
SummaryAnalysis of appliance sales indicated relationships between temperature and seasonal-product sales at certain times of year, and the capacity for retailers to increase sales based on two-week temperature forecasts.AppendixJMA two-week temperature forecastsJMA provides online two-week forecasts of temperature in graphic/numerical form and via downloadable files containing more detailed information.Two-week temperature forecast graphs (as per Figure A1) are provided at https://www.data.jma.go.jp/cpd/twoweek/en/?fuk=46 for individual prefectures with maximum and minimum forecast temperatures averaged over five days for the second week, as well as daily maximum and minimum temperatures for the previous week (observation) and the next week (forecast). Two-week forecasts can be downloaded in MS Excel format at https://www.data.jma.go.jp/risk/probability/guidance/csv_k2w.php (in Japanese), with content indicating distribution functions and cumulative distribution functions of two-week temperature forecasts. 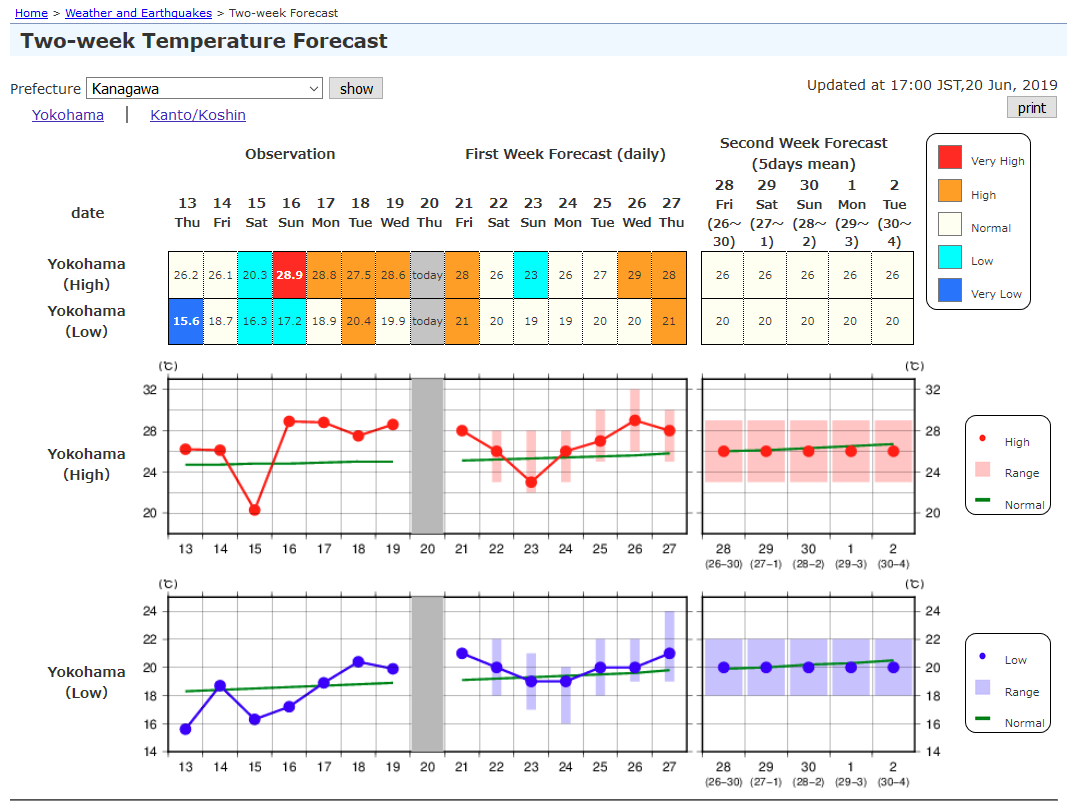
Figure A1 Figure A1 Two-week JMA forecast at https://www.data.jma.go.jp/cpd/twoweek/en/?fuk=46 |