Introduction
The Japan Meteorological Agency (JMA) is conducting a project to promote climate risk management (CRM) in various sectors. CRM involves reducing climate risk caused by heat waves, cold spells and other extreme events using extended-range weather forecast data such as Early Warning Information on Extreme Weather (two-week forecasts) and One-month Forecasts.
In the research reported here, which is part of this project, JMA and Life & Business Weather, Inc. (LBW) investigated the relationship between fashion item sales and temperature along with other weather factors. The use of two-week forecasts for added benefit in sales promotion was also investigated.
The Japan Apparel Fashion Industry Council (JAFIC) and related companies kindly contributed to the study by providing several years' worth of fashion sales data. Factors in the relationship between weather and fashion sales have frequently been discussed, and stakeholders have developed ways of modifying their sales management using two-week forecasts.
A significant correlation was found between sales volumes and weather factors. It was concluded that two-week forecasts can help sales managers plan matters such as which items should be prioritized and how to manage the supply of products.
Results
There is a significant correlation between sales and temperature.
-
There are threshold temperatures at which sales increase remarkably (Table 1, Figure 1).
-
For some items, sales are related to other weather factors (Table 2).
-
Sales tend to fluctuate in phase with weekly average temperature variations.
Table 1 Threshold temperatures for individual items
Items (for women) |
Threshold temperature (Celsius) |
Sandals |
Above 15 degrees |
Knitwear |
Below 27 degrees |
Blousons |
Below 25 degrees |
Winter innerwear |
Below 15 degrees |
Coats |
Below 18 - 19 degrees |
Knitted hats |
Below 15 degrees |
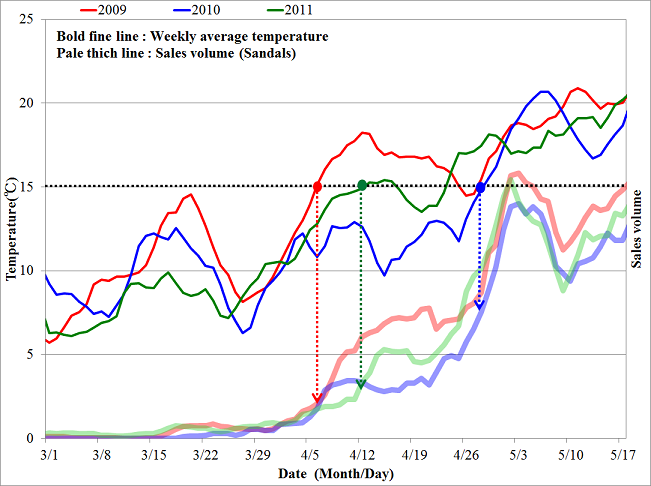
Figure 1 Time-series representation of sandal sales and mean temperetures
-
Sandals are a typical spring/summer item.
Sales in March are quite low and start to increase in April as temperatures rise.
-
Sales increase sharply when the temperature reaches 15°C.
-
This is the threshold temperature for sandal sales.
Table 2 Items affected by non-temperature weather factors
Item |
Factor |
Characteristics |
Parasols |
Sunshine intensity |
Parasol sales increase with solar radiation intensity from April to July. |
Rain boots |
Rainfall |
Rain boot sales increase around rainy days. |
Apparel company experts made the following comments on these results:
-
The results help us organize alternatives to regular items when temperatures remain extremely high in early autumn.
-
Women tend to purchase knitted hats not only for protection against the cold but also as fashion items. As a result, even if the temperature is higher than normal, there is advance demand unrelated to temperature. However, the relationship between temperature and sales greatly helps our understanding of design for individual stores and related planning.
-
It is surprising that the sales shares of selling areas vary with temperature. This relationship will help us design sales area plans based on temperature variations.
Adaptation to Climate Risk
|
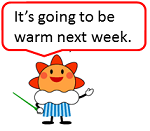
Various stakeholders can take measures against climate risk using forecast products. In the case of the sandals mentioned previously, the two-week forecasts (Figure 2) indicates a high possibility of temperatures exceeding 15°C, so shoe company managers should check that there is a sufficient stock, and should frequently replenish stock. Floor managers may also wish to prioritise the display of sandals in the selling area.
On the basis of the results obtained and discussions with apparel experts, the following plans for sales promotion might be implemented:
-
Modification of supply volume from warehouses to stores
-
Strengthening of visual merchandising (VMD) methods such as point-of-purchase (POP) placement
-
Development of sales talk for customers
-
Arrangement of sales floor plans
|
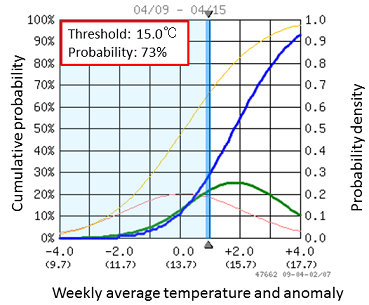
Figure 2 JMA two-week forecast
Initial date/location: 2nd April 2009, Tokyo
Cumulative probability : forecast (blue), normal (yellow)
Probability density : forecast (green), normal (pink)
|
Demands from Experts and Future Strategy
-
The average temperature is not easy to understand intuitionally in many industries, so forecasting for the maximum or minimum temperature would be preferable.
-
A map representation showing the probability of temperatures being higher/lower than expected in the coming two-week period would be useful.
-
As the threshold temperature differs for each area, more precise analysis should be conducted for individual regions.
-
Guidelines should be provided on how to use JMA's probabilistic forecasts.
|