Atmospheric carbon monoxide observation
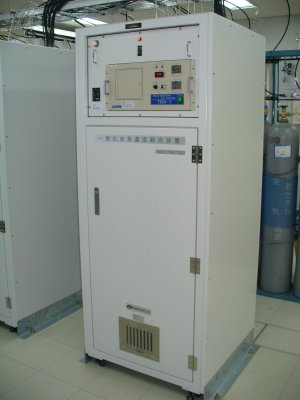
Atmospheric CO concentrations are observed using a gas chromatograph (GC) equipped with a reduction gas detector (RGD) . The TRA-1 system model (Round Science Inc.; Figure 1) is used for this purpose at observation stations. The stability of the observation system (expressed as the standard deviation of six repeated measurements) does not exceed 2 ppb, and its repeatability (expressed by the difference between two runs of the above stability test) does not exceed ±1 ppb.
|
Figure 1: CO observation system at Yonagunijima |
Air sample collection and analysis
Air samples are collected from the same intake used for CO2 observations at a height of about 20 m above the ground before being dried to a dew point temperature not exceeding −75 °C and introduced to the observation system at a flow rate of 250 mL per minute. System outputs for the air samples are obtained by analyzing the output waveform from the analyzer every ten minutes. CO concentrations for the working standard gases are observed every eight hours.
Determination of concentration
The outputs for the air samples are converted into concentration values at JMA Headquarters using a quadratic calibration curve determined for each measurement cycle based on the known concentrations of working standard gases and the corresponding outputs. Four working standard gases (natural air-base types) with different concentrations are analyzed to accurately determine concentration using a GC-based CO calibration system at the headquarters with reference to JMA's standard gases before use at stations (see Calibration for atmospheric carbon monoxide observation ) . To minimize errors caused by temporal variations in the response of the analyzer, two concentrations are calculated from calibration curves before and after air sample measurement. These two values are then time-interpolated to determine concentration for every ten minutes.
The working standard gases are also analyzed again at JMA Headquarters with reference to JMA's standard gases after use. Comparing the concentrations before and after use allows precise determination of concentration changes (drifts) in the standard gases during use so that concentrations can be corrected.
JMA's standard gases are calibrated against the WMO reference standards maintained by NOAA/ESRL, which allows the direct comparison of concentration data collected at stations with those from locations in other countries where the WMO reference standard gases are used.
As gas consumption is low in GC analysis, the working standard gases can be used for several years from the filling date. However, JMA calibrates these gases once a year to determine CO concentrations.
Background data selection and statistics
The selection procedure for background data to be used for the calculation of hourly, daily and monthly mean values is the same as that for CO2 (see Atmospheric carbon dioxide observation ) with the threshold values shown in Table 1.
|
Table 1: CO background data thresholds |
| Site | Period | Standard deviation | Continuity |
|---|---|---|---|
| Ryori | January 1991 - December 2008 | 8 ppb | 4 ppb |
| January 2009 - | 6 ppb | 4 ppb | |
| Minamitorishima | January 1994 - December 2009 | 4 ppb | 4 ppb |
| January 2010 - | 3 ppb | 4 ppb | |
| Yonagunijima | January 1998 - December 2007 | 8 ppb | 4 ppb |
| January 2008 - | 6 ppb | 4 ppb |