Atmospheric carbon dioxide observation
Analyzer
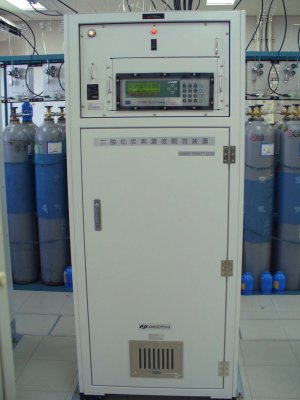
Atmospheric carbon dioxide (CO2) concentrations are observed using a non-dispersive infrared analyzer (NDIR) leveraging CO2's infrared radiation absorption characteristic. The LI-7000 system model (LI-COR Biosciences, inc.; Figure 1) is used for this purpose at the JMA's observation stations. The stability of the observation system (expressed as a 15-minute average standard deviation) does not exceed 0.02 ppm, and its repeatability does not exceed ±0.02 ppm, which is the difference between the results of two runs of the above stability test.
|
Figure 1: CO2 observation system at Yonagunijima |
Air sample collection and analysis
Air samples are collected through an intake at a height of about 20 m above the ground before being dried to a dew point temperature not exceeding −75 °C and introduced to the observation system at a flow rate of 500 mL per minute. The analyzer measures air samples and outputs 30-second averages of output voltages measured every second, while working standard gases in five cylinders are measured every two hours for three minutes per cylinder.
Determination of concentration
The 30-second average output voltages for the air samples are converted into concentration values at JMA Headquarters. Five working standard gases of natural air-base CO2 with different concentrations are also analyzed at the headquarters to accurately determine concentration using an NDIR-based CO2 calibration system with reference to JMA's standard gases before use at stations (see Calibration for atmospheric carbon dioxide observation ) .
Output voltages are converted to concentration values using a quadratic calibration curve determined for each measurement cycle based on the known concentrations of working standard gases and the corresponding output voltages. To minimize errors caused by temporal variations in the response of the analyzer, two concentrations are calculated from calibration curves before and after air sample measurement. These values are then time-interpolated to determine 30-second concentrations.
The working standard gases are also analyzed again at JMA Headquarters with reference to JMA's standard gases after use. Comparing the concentrations before and after use allows precise determination of concentration changes (drifts) in the standard gases during use so that concentrations can be corrected.
JMA's standard gases are calibrated against the WMO reference standards maintained by NOAA/ESRL, which allows the direct comparison of concentration data collected at stations with those from locations in other countries where the WMO reference standard gases are used.
The filling pressures of the working standard gases are typically around 15 MPa (or 12 MPa at Ryori) at the beginning of use. To avoid drift caused by contaminants from the cylinder wall, use of the gases is stopped before their pressure falls below 3.5 MPa. The usage period of working standard gases is usually about six months.
Background data selection and statistics
Large variations in CO2 concentration may be observed even within a matter of hours due to local changes considered to be associated with anthropogenic or vegetation activity within the surface boundary layer under certain weather conditions. Data without such local variations need to be selected to obtain atmospheric background information representing average values for a horizontally wide space within the surface boundary layer. An air mass affected by local variations is assumed to undergo larger temporal changes due to its smaller spatial scale. As many data as possible should ideally be selected with locally affected examples removed to give highly reliable background data.
JMA uses the following background data selection procedure:
- The hourly mean for all observations excluding those made during inspections, periods of system malfunction and other such situations are calculated.
- Hourly mean values made up of less than half the requisite 30-second average observation values are rejected.
- Hourly mean values are rejected when the standard deviation of the observed values on which calculation is based exceeds a certain prescribed threshold.
- Hourly mean values differing from both the immediately following and preceding values by more than a prescribed threshold of continuity are rejected.
- Hourly mean values remaining after the above steps are regarded as background data.
- Daily mean values are calculated from the hourly values selected as background data.
- Monthly mean values are calculated from hourly values selected as background data.
- Annual mean values are calculated from monthly values.
The thresholds detailed above are determined by evaluating past observation data on an observation location basis in order to exclude concentration data affected by local factors while utilizing as many background data as possible. The prescribed thresholds for CO2 are listed in Table 1.
|
Table 1: CO2 background data thresholds |
| Site | Period | Standard deviation | Continuity |
|---|---|---|---|
| Ryori | January 1987 - | 0.6 ppm | 0.6 ppm |
| Minamitorishima | March 1993 - | 0.3 ppm | 0.3 ppm |
| Yonagunijima | January 1997 - | 0.6 ppm | 0.3 ppm |
See Background data for greenhouse gas and reactive gas observation for information on the selection of background data in observations.