Updated on 20 Feb. 2026
Japan Meteorological Agency
An increase in the globally integrated ocean heat content (0 – 2000 m) was observed from 1955 to 2025 with a linear trend of 6.39 × 10²² J per decade.
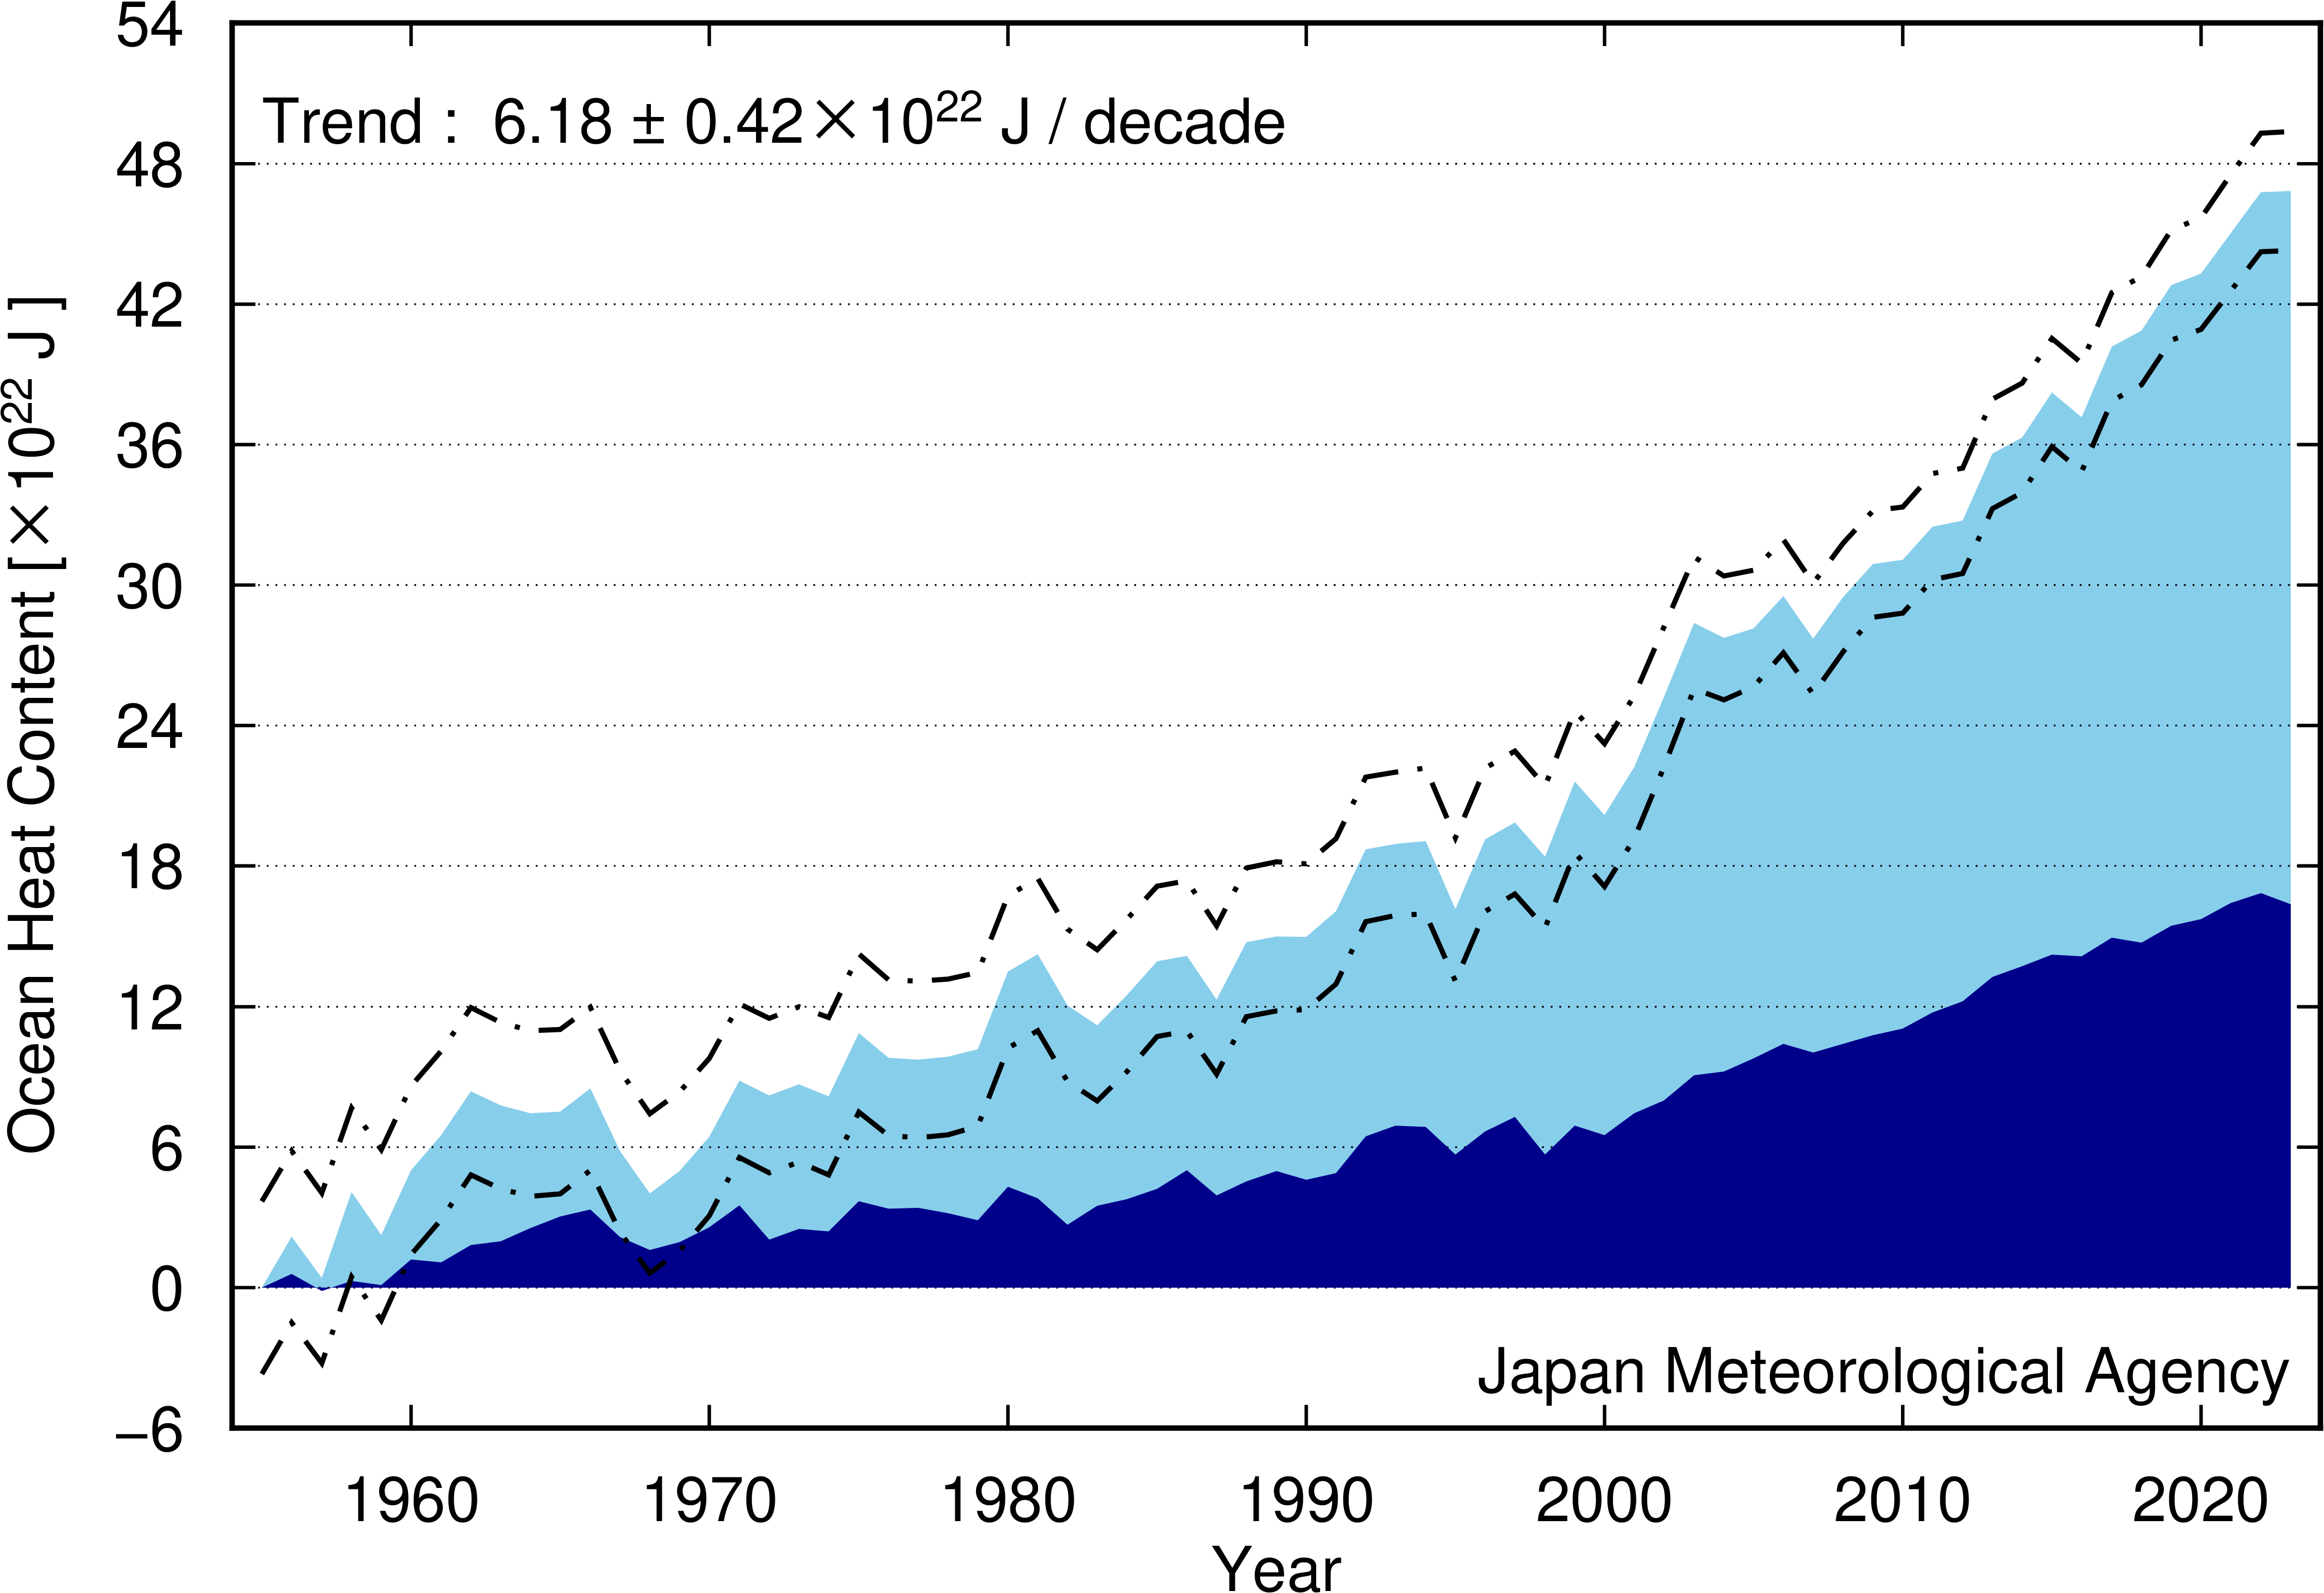
Time series representation of the globally integrated ocean heat content (0 – 2000 m) relative to 1955
The light (dark) blue area shows the annual mean for the global integrals of 0 to 700 m (700 to 2000 m) ocean heat content relative to 1955, respectively. The dot-dashed lines indicate a 95% confidence level for ocean heat content above 2000 m. These data are updated from Ishii et al. (2017).
Heat content anomaly time series (txt file:4KB)
Analyzed global fields (ASCII files)
The values here may be replaced as new data is obtained.
Oceans have a significant impact on the global climate because they cover about 70% of the earth's surface and have high heat capacity. According to the Intergovernmental Panel on Climate Change Sixth Assessment report (IPCC, 2021), about 56% of the net energy increase in the climate system from 1971 to 2018 is stored in the upper ocean (0 – 700 m), and about 35% is stored below 700 m. Oceanic warming results in sea level rises due to thermal expansion, and impacts marine ecosystems.
It is virtually certain that globally integrals of 0 to 2000 m ocean heat content (OHC) rose between 1955 and 2025 at a rate of 6.39 ± 0.43 × 10²² J per decade as a long-term trend with interannual variations (the range indicated by '±' represents a 95% confidence level). A rise of 0.022 ± 0.001 °C per decade in the globally averaged 0 to 2000 m ocean temperature accompanied the OHC increase. Oceans exhibited marked warming since the mid-1990s.
These long-term trends can be attributed to global warming caused by increased concentrations of anthropogenic greenhouse gases such as CO2 as well as natural variability.