Updated on 15 Feb. 2024
Japan Meteorological Agency
The annual mean global average sea surface temperature in 2023 was +0.40°C above the 1991-2020 average, making it the highest since 1891. The linear trend from 1891 to 2023 shows an increase of 0.61°C per century.
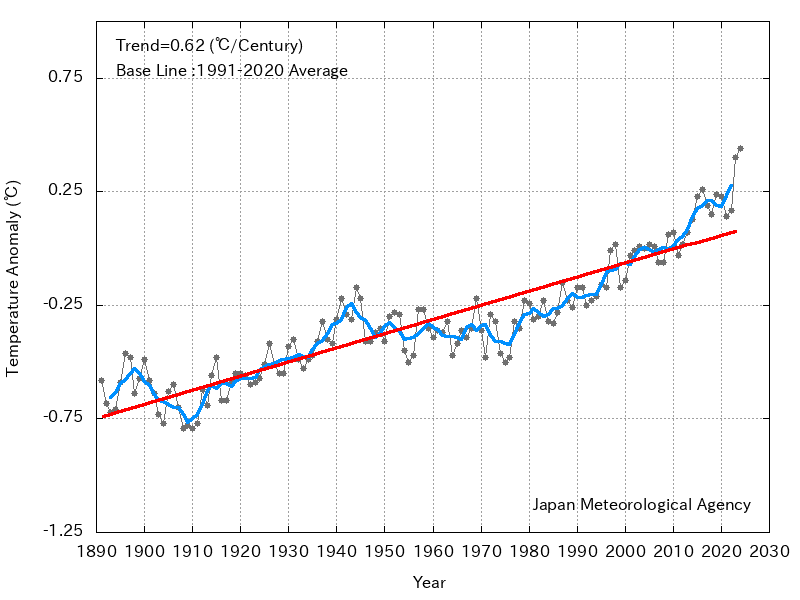
Time-series representation of annual global sea surface temperature anomalies
The 1991 - 2020 average is used as the normal.
The black, blue and red lines represent annual global sea surface temperature anomalies,
their five-year running mean and the long-term linear trend, respectively.
The annual mean global average sea surface temperature in 2023 was +0.40°C above the 1991-2020 average, making it the highest since 1891. All of the past ten years (2014-2023) ranked among the ten warmest years since 1891.
On a multi-year time scale, the global average sea surface temperature showed warming trends from around 1910 to around 1940 and from the mid-1970s to around 2000, and remained at the same level from the 1940s to the mid-1970s and from around 2000 to the early 2010s.
A long-term warming trend is observed along with such decadal to multi-decadal variability, with the linear trend of 0.61°C per century from 1891 to 2023 associated with the global warming. The annual mean of the global average sea surface temperature varies in a way generally similar to that of the global average land surface temperature. It should be noted that the long-term trend observed for the period from 1880 to 2023 shows an increase of 0.89°C per century for land surface temperature, which is higher than that for sea surface temperature.
According to the IPCC Sixth Assessment Report, it is unequivocal that human influence has warmed the atmosphere, ocean and land. The report also states that widespread and rapid changes in the atmosphere and ocean have occurred.