IntroductionThe Japan Meteorological Agency (JMA) conducted a survey on climate risk management in relation to vending machine drink sales in collaboration with the Japan Soft Drink Association (JSDA).Climate risk management (CRM) involves understanding and taking effective measures against anomalous conditions such as heat waves and cold spells. It involves (1) recognizing climate risks (awareness), (2) quantitative evaluation of such risks (assessment), and (3) related response based on climate information (adaptation). 1. CRM Awareness It is trivial that hot drinks sell better in winter and cold drinks sell better in summer. 2. CRM Assessment The ideal atmospheric temperature for switching cold drinks to hot drinks in vending machines was determined in consideration of the above awareness. 3. CRM Adaptation It was deemed possible to reduce sales losses based on atmospheric temperature forecasts up to two weeks ahead as provided in real time on the JMA website. Quantitative relationship between atmospheric temperature and soft drink sales – climate risk assessmentIt is trivial that hot drinks sell better in winter and cold drinks sell better in summer. To leverage the mechanics of this relationship in sales management, the quantitative association between atmospheric temperature and sales needs to be clear.Specifically, the point at which hot drink sales begin to increase as temperatures fall needs to be quantitatively clarified so that vendors can meet demand by changing the content of their machines. Against this background, the relationship between atmospheric temperature and hot-coffee vending machine sales was examined. Seven-day averages for temperature and sales volumes were considered in order to eliminate the effects of day-to-day sales variations. The index values here are calculated from the number of sales per day divided by the average number of sales per day in 2016. Figure 1 indicates reduced sales of hot coffee with higher temperatures and increased sales with lower temperatures in Tokyo. Sales begin to increase in the second half of September, and correspond to temperature fluctuations from October onward. In April, volumes decline sharply and approach zero at a certain atmospheric temperature because most machine content is allocated to cold drinks. 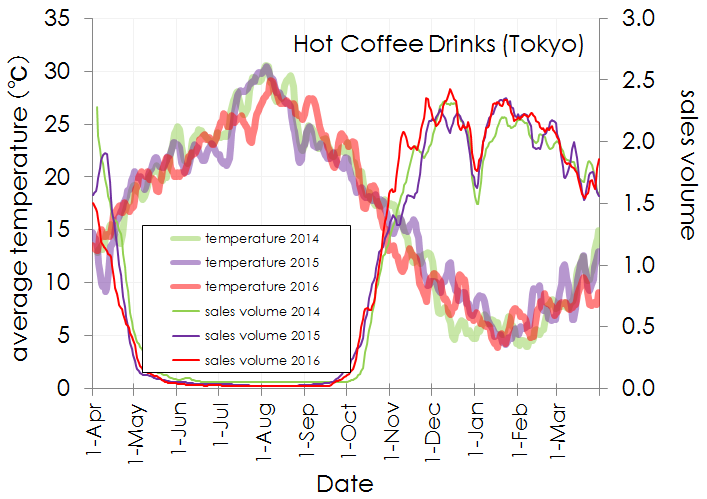
Figure 1 Sales of hot coffee from vending machines (thin lines, right axis) vs. average temperature (thick lines, left axis) in Tokyo from 2014 to 2016. Figure 2, which shows average temperature (horizontal axis) and hot-coffee sales from outdoor vending machines (vertical axis) in Tokyo from April 2014 to March 2017, indicates higher volumes as temperatures fall below 22°C but almost zero volumes above this temperature. A similar relationship between sales and atmospheric temperature was observed in other regions and with other items. 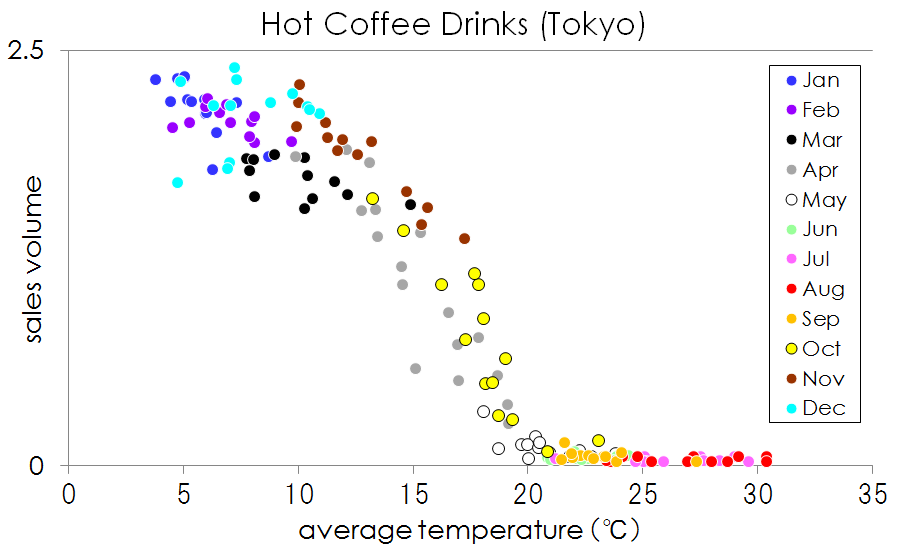
Figure 2 Average temperatures (horizontal axis) and outdoor vending machine hot-coffee sales (vertical axis) in Tokyo. Months are represented in different colors. Preliminary analysis on switching of cold drinks for hot drinks – climate risk adaptationSales from 31 Tokyo vending machines in which cold drinks were replaced with hot drinks at different times (15 units before October 17th and 16 thereafter) were compared using October 2017 data from JSDA members.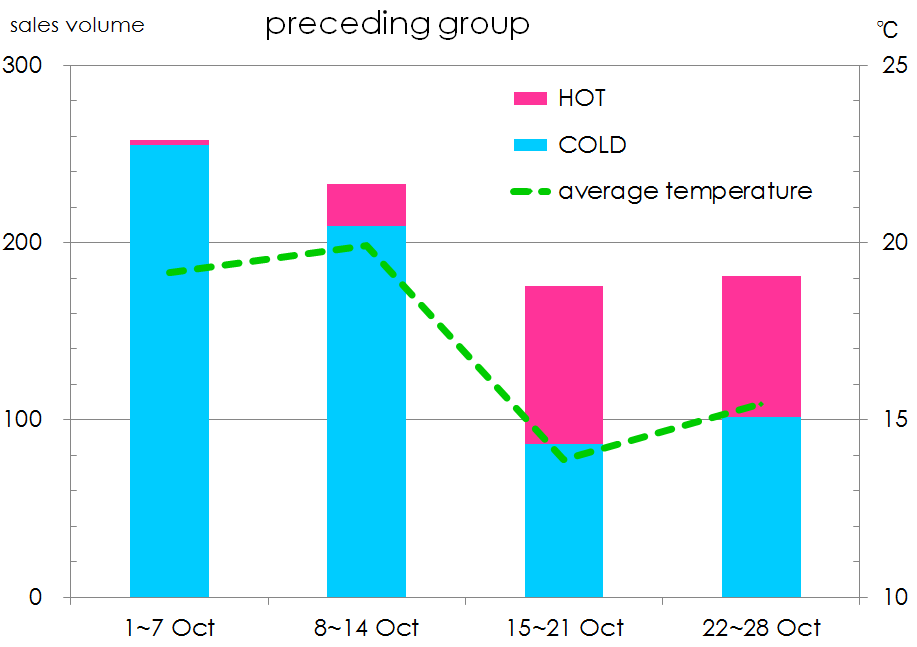
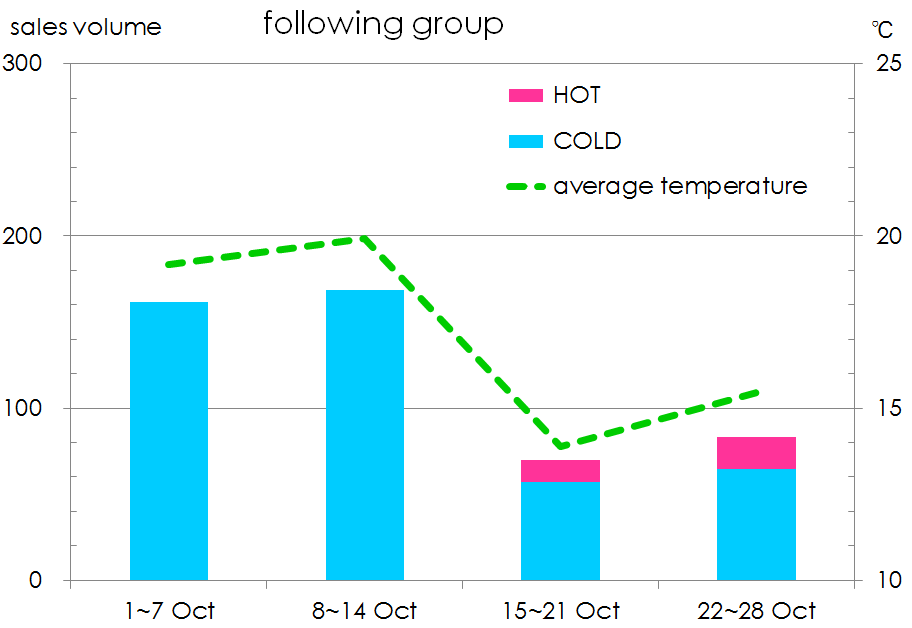
Figure 3 Sales from outdoor vending machines and average temperatures in Tokyo for October 2017. Bars represent sales (left axis) and dashed lines represent average atmospheric temperatures (right axis). Figure 3 shows weekly sales per vending machine divided into hot (red) and cold (blue) drinks for October 2017. Weekly mean temperatures are shown in linear form. The sharp drop of approximately 6℃ in the average temperature in the third week of October corresponded to an increase in sales of hot drinks. However, sales in the following group were lower because cold-drink sales decreased in both periods after the drop in temperature. That is, sales in the preceding group were largely steady overall, while those in the following period showed a reduction due to lost sales opportunities. These outcomes indicate that replacing cold drinks with hot drinks in vending machines with appropriate timing reduces lost sales in fall when temperatures are decreasing. Consideration of two-week forecasts in vending-machine stockingAdvance information on temperature reductions enables replacement of cold drinks with hot drinks to limit sales losses. JMA’s daily two-week temperature forecasts support decisions on such replacement.SummaryThe results of the study showed a strong relationship between fluctuations in atmospheric temperature and sales of hot/cold drinks from vending machines, and indicated an appropriate temperature for related stock changes. Correct timing for replacement helps to reduce sales losses based on two-week temperature forecasts provided by JMA.AppendixJMA two-week temperature forecastsJMA provides online two-week forecasts of temperature in graphic/numerical form and via downloadable files containing more detailed information.Two-week temperature forecast graphs (as per Figure A1) are provided at https://www.data.jma.go.jp/cpd/twoweek/en/?fuk=46 for individual prefectures with maximum and minimum forecast temperatures averaged over five days for the second week, as well as daily maximum and minimum temperatures for the previous week (observation) and the next week (forecast). Two-week forecasts can be downloaded in MS Excel format at https://www.data.jma.go.jp/risk/probability/guidance/csv_k2w.php (in Japanese), with content indicating distribution functions and cumulative distribution functions of two-week temperature forecasts. 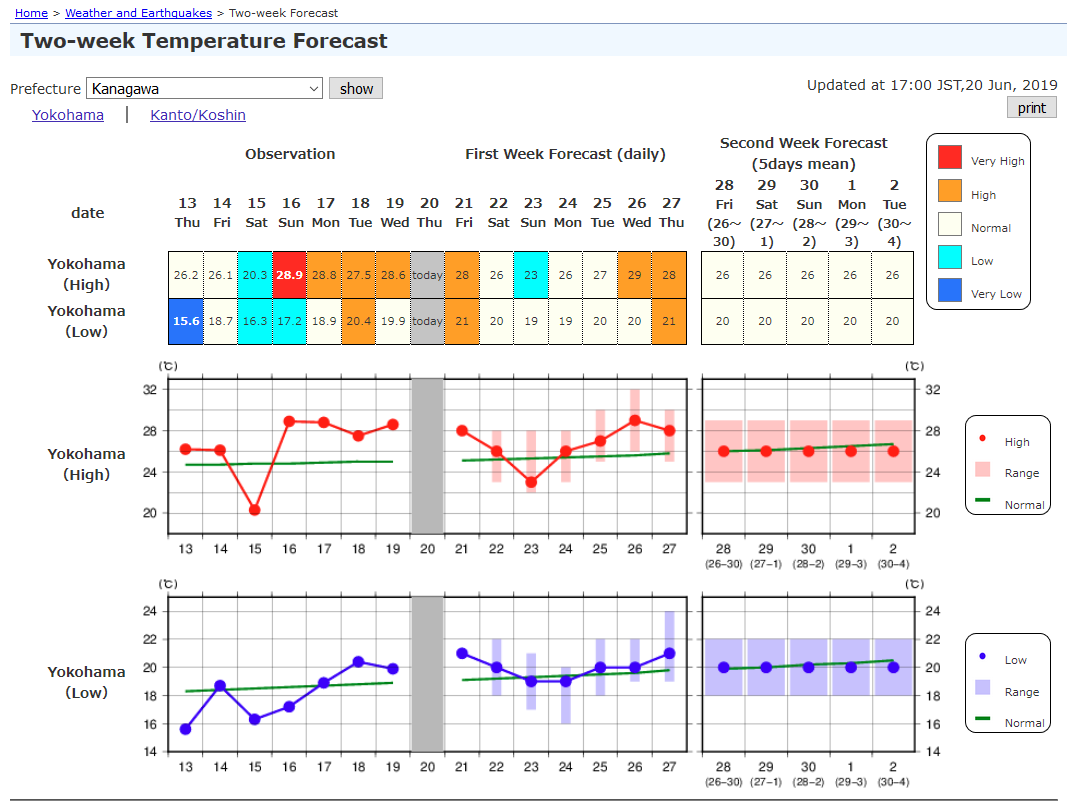
Figure A1 Figure A1 Two-week JMA forecast at https://www.data.jma.go.jp/cpd/twoweek/en/?fuk=46 |