Fog Monitoring
General fog characteristics
As meteorological satellite observation from space does not readily enable determination between fog (a ground-contact cloud type) and stratus (a non-contact type), related analysis often does not draw a distinction between the two.
Fog appears dark grey (or even darker) in infrared satellite imagery, making it difficult to identify due to the low temperature difference between the low cloud top and the surrounding land/sea. Fog forming during periods of strong surface inversion is called black fog because the cloud top (which is warmer than the fogless surrounding surface) appears blacker than the surface ground.
Fog appears as grey-white in visible imagery, with a smooth and uniform top surface. The top is almost flat, and inland fog boundaries often form along contours. As such, fog not covered by thick upper or middle cloud is clearly visible in such imagery. Fog under thin transparent upper cloud can be identified, but may be confused with rough convective cloud when covered by grayish upper cloud casting shadows over its surface. Moving images provide an effective means of observing fog areas, which tend to move and change shape slowly.
As fog is generally less than several hundred meters thick, fogless gaps occasionally appear on the leeward side of obstacles higher than its top, such as mountains and hills. These can be used to determine local wind direction.
Daytime fog
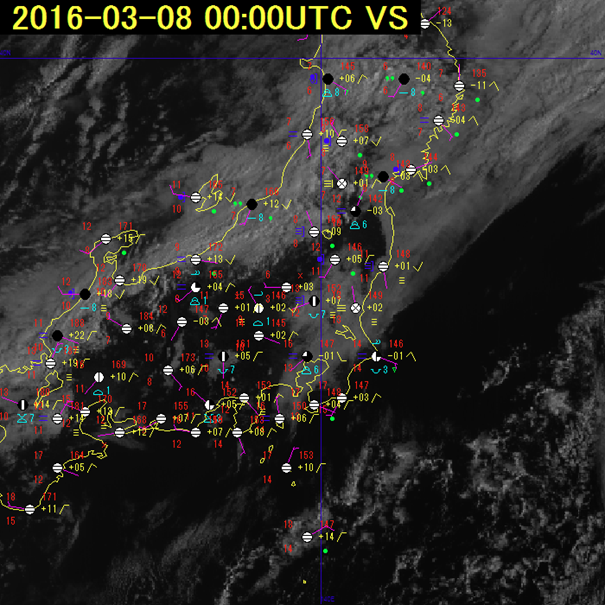
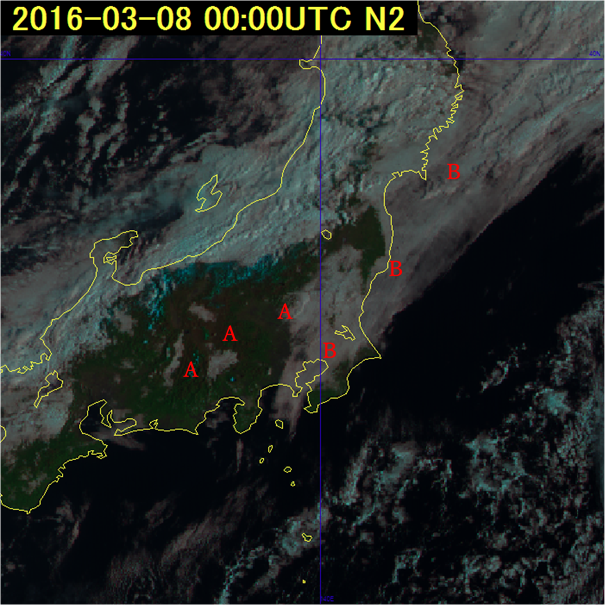
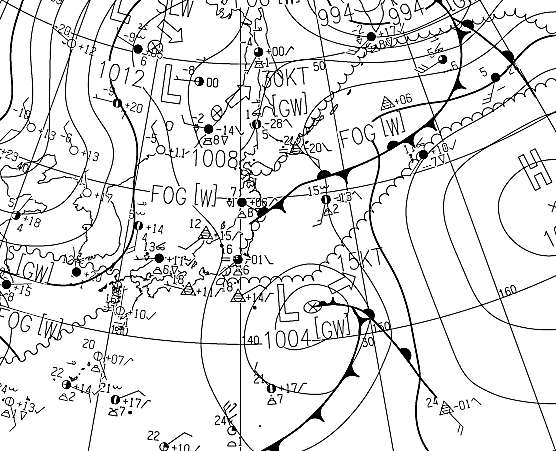
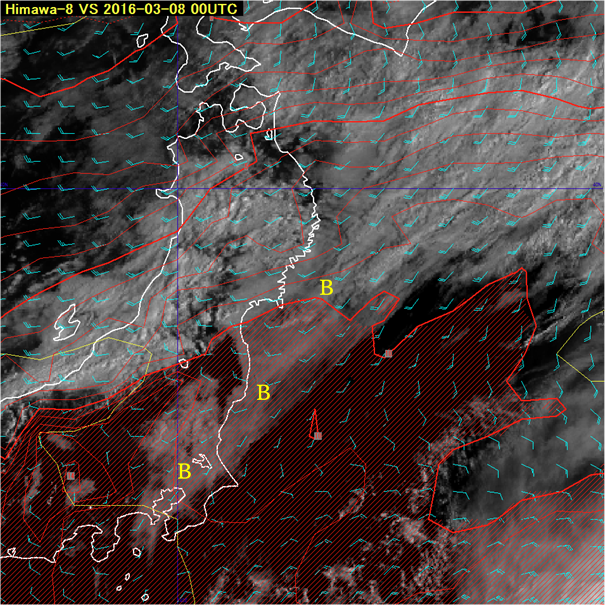
Figure 1 shows a visible image (0.64µm) and surface meteorological observations at 00:00 UTC on 8 March 2016, and Figure 2 shows a Natural Color RGB composite image for the same time. The scattered white cloud areas around "A", and the veil-like areas around "B" represent the fog seen in satellite imagery. They are the fog visualized in the satellite image. The fog around "A" results from radiative cooling at night, and that around "B" results from advection of warm humid wind. Some of the fog around "A" is a mixture of both types. .
Radiation fog is associated with temperature reductions caused by nighttime radiative cooling on land surfaces, and often forms along terrain features such as valleys and basins. It is generally stationary and expands with time before dissipating rapidly in morning sunlight.
The advection fog around "B" does not dissipate as rapidly as radiation fog in the morning. Time-series satellite imagery shows the northward migration of fog density. Here (00:00 UTC on 8 March 2016), the observation shows fog formed by saturation and condensation of lower air, creating a warm humid mass from the southwest flowing over cold sea water.
Figure 3 shows a surface weather chart at 00 UTC on 8 March 2016.
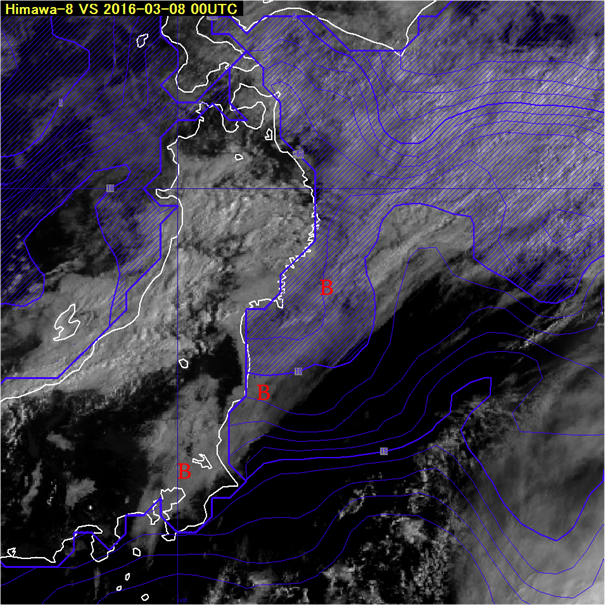
Figure 4 shows the distribution of height, wind and temperature at 925 hPa from numerical weather prediction based on JMA&prim;s Meso-Scale Model (MSM), and Figure 5 shows the distribution of sea surface temperature. The areas of fog formation around "B" correspond to those where warm humid air flows from the southwest into places with low sea surface temperatures.
Nighttime fog
With Himawari-6/7 data, the brightness temperature difference (BTD) between Band 7 (3.9 μm) and Band 13 (10.4 μm) was utilized to detect nighttime fog. With Himawari-8/9, Night Microphysics RGB composite images with clearer representation of such fog are used.
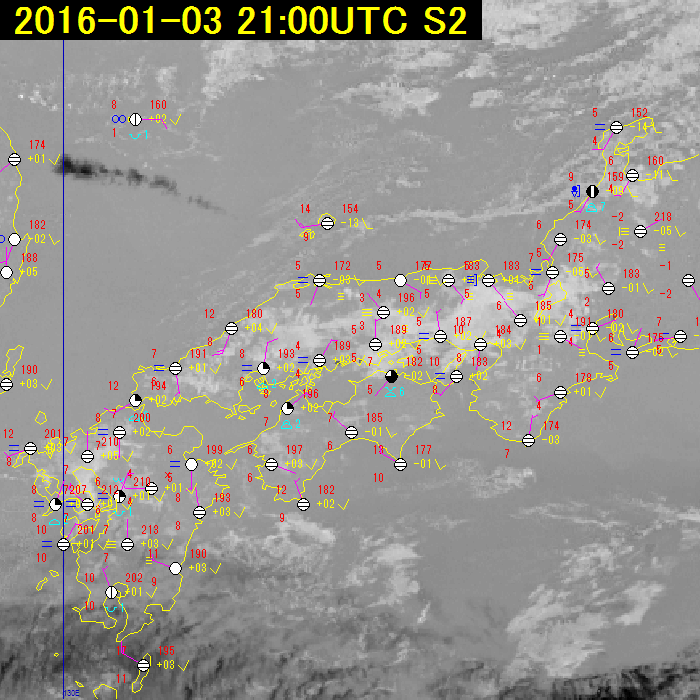
Figure 6 shows the BTD between the above two bands based on surface meteorological observation conducted at 21 UTC on 3 January 2016. A number of white regions are seen, and fog was observed in western Japan.
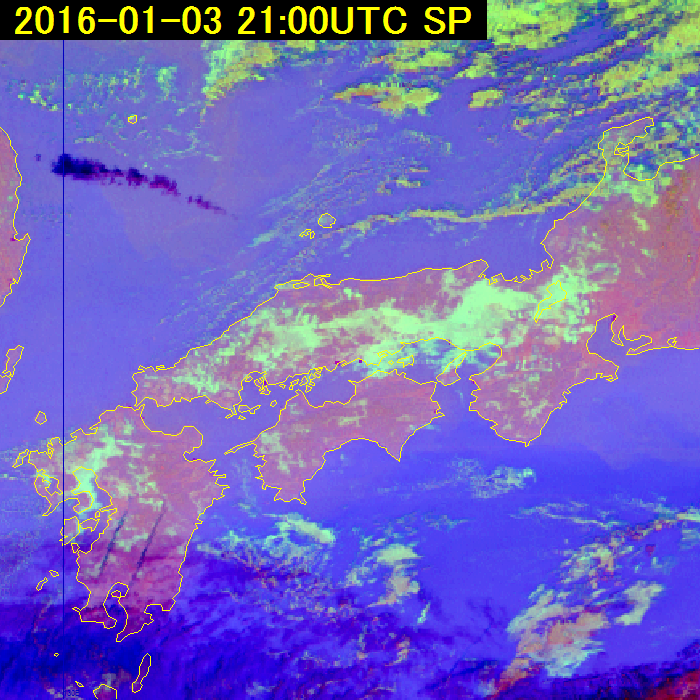
In the Figure 7 Night Microphysics RGB composite imagery for the same time, fog is observed (blue-green) over western Japan more clearly than in Figure 6. This image is based on the BTD between the infrared Bands 15 (12.4 μm) and 13 (10.4 μm) as the red component, that between Bands 13 (10.4 μm) and 7 (3.9 μm) as the green component, and Band 13 (10.4 μm) as the blue component. Night Microphysics RGB composite imagery thus provides more information than single conventional BTD imagery, making it effective for monitoring of nighttime fog and low cloud.