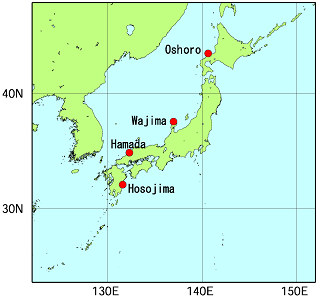
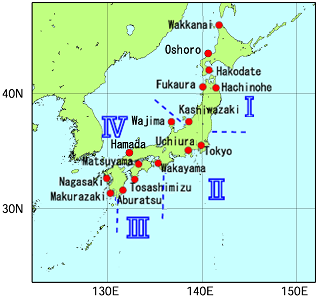
Locations of tide gauge stations
Tide gauge stations assessed as being affected to a lesser extent by crustal movement are selected for monitoring of sea levels.
The four stations shown on the map on the left were selected for the period from 1906 to 1959, and the 16 on the right are for the period from 1960 onward.
These 16 stations are divided into four regions (I – IV) for the latter period.
The stations at Oshoro, Kashiwazaki, Wajima and Hosojima belong to the Geospatial Information Authority of Japan.
Sea level data for the Tokyo station are available from 1968 onward.
Sea level data from 2011 to 2025 at Hakodate, Fukaura, Kashiwazaki, Tokyo and Hachinohe are not used due to the influence of the 2011 Great East Japan Earthquake.
Sea level data of 2024 to 2025 at Wajima is not used due to the influence of the 2024 Noto Peninsula Earthquake.
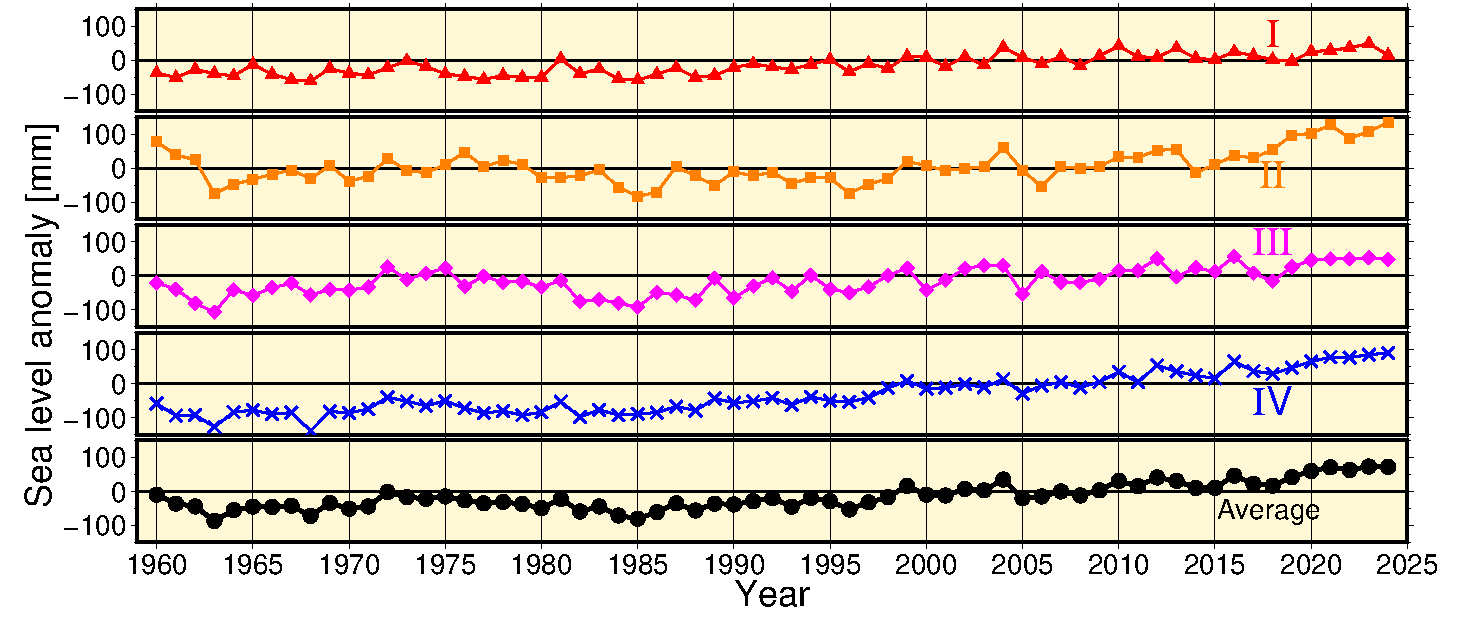
Time-series representation of annual mean sea level anomalies (1960 – 2025) for the four regions
Four-region annual sea level anomaly time series (comma-separated value file: 2 KB)
Rate of sea level rise in each region (mm/year)
| I | II | III | IV | Average | Global mean (IPCC AR6) |
|
|---|---|---|---|---|---|---|
| 1960 – 2025 | 1.3 [1.1 – 1.5] | 1.3 [0.8 – 1.7] | 1.3 [1.0 – 1.7] | 2.8 [2.5 – 3.0] | 1.7 [1.4 – 1.9] | |
| 1971 – 2006 | 1.3 [0.8 – 1.8] | * | * | 2.2 [1.6 – 2.7] | 0.9 [0.3 – 1.5] | 1.9 [0.8 – 2.9] |
| 2006 – 2018 | * | 4.9 [1.4 – 8.4] | * | 4.0 [1.6 – 6.3] | 2.9 [0.8 – 5.0] | 3.7 [3.2 – 4.2] |