Section 0
Section 1
Section 2
D.....D
YY
GG
iw
0 Wind speed estimated Wind speed in m/s
1 Wind speed obtained from anemometer Wind speed in m/s
3 Wind speed estimated Wind speed in knots
4 Wind speed obtained from anemometer Wind speed in knots
LaLaLa
Qc
When the ship is on the Greenwich meridian or the 180th- meridian (LoLoLoLo = 0000 or 1800 respectively):
- Qc = 1 or 7 (northern hemisphere) or
- Qc = 3 or 5 (southern hemisphere);
- When the ship is on the Equator (LaLaLa = 000):
- Qc = 1 or 3 (eastern longitude) or
- Qc = 5 or 7 (western longitude).
LoLoLoLo
iR
Code Precipitation data
figure are reported: Group 6RRRtR
  is:
0 In Sections 1 and 3 Included in both sections
1 In Section 1 Included
2 In Section 3 Included
3 In none of the two Omitted
Sections 1 and 3 (precipitation amount = 0)
4 In none of the two Omitted
Sections 1 and 3 (precipitation amount not available)
ix
figure |
||
h
Code
figure
0 0 to 50 m
1 50 to 100 m
2 100 to 200 m
3 200 to 300 m
4 300 to 600 m
5 600 to 1000 m
6 1000 to 1500 m
7 1500 to 2000 m
8 2000 to 2500 m
9 2500 m or more, or no clouds
/ Height of base of cloud not known or base of
  clouds at
a level lower and tops at a level higher than that
  of
the station
Notes:
(1) A height exactly equal to one of the values
  at the ends
of the ranges shall be coded in the higher range,
  e.g.
a height of 600 m shall be reported by code figure
  5.
(2) Due to the limitation in range of the cloud-sensing
equipment used by an automatic station, the code
  figures
reported for h could have one of the three following
meanings:
(a) The actual height of the base of the cloud
  is
within the range indicated by the code figure;
  or
(b) The height of the base of the cloud is greater
than the range indicated by the code figure but
cannot be determined due to instrumental
limitations; or
(c) There are no clouds vertically above the station.
VV
N
dd
ff
fff
s
n
code
figure
0 Positive or zero
1 Negative
TTT
T
dTdTd
UUU
P
oPoPoPo
PPPP
a
Code
figure
0 Incresing, then decreasing; atmospheric pressure
  the same or higher
than 3 hours ago
1 Increasing, then steady;or increasing then increasing
  more slowly;
atmospheric pressure now higher than 3 hours ago
2 Increasing (steadily or unsteadily); atmospheric
  pressure now higher
than 3 hours ago
3 Decreasing or steady, then increasing; or increasing,
  then increasing
more rapidly; atmospheric pressure now higher than
  3 hours ago
4 Steady; atmospheric pressure the same as 3 hours
  ago
5 Decreasing, then increasing; atmospheric presure
  the same or lower
than 3 hours ago
6 Decreasing, then steady; or decreasing, then
  decreasing more slowly;
atmospheric pressure now lower than 3 hours ago
7 Decreasing (steadily or unsteadily); atmospheric
  pressure now lower
than 3 hours ago
8 Steady or increasing, then decreasing; or decreasing,
  then decreasing
more rapidly; atmospheric pressure now lower than
  3 hours ago
ppp
RRR
Code Code
figure figure
000 Not used 990 Trace
001 1 mm 991 0.1 mm
002 2 mm 992 0.2 mm
etc. etc. 993 0.3 mm
988 988 mm 994 0.4 mm
989 989 mm or more 995 0.5 mm
996 0.6 mm
997 0.7 mm
998 0.8 mm
999 0.9 mm
t
R
Code
figure Total precipitation during
1 the 6 hours preceding the observation
2 the 12 hours preceding the observation
3 the 18 hours preceding the observation
4 the 24 hours preceding the observation
5 the 1 hours preceding the observation
6 the 2 hours preceding the observation
7 the 3 hours preceding the observation
8 the 9 hours preceding the observation
9 the 15 hours preceding the observation
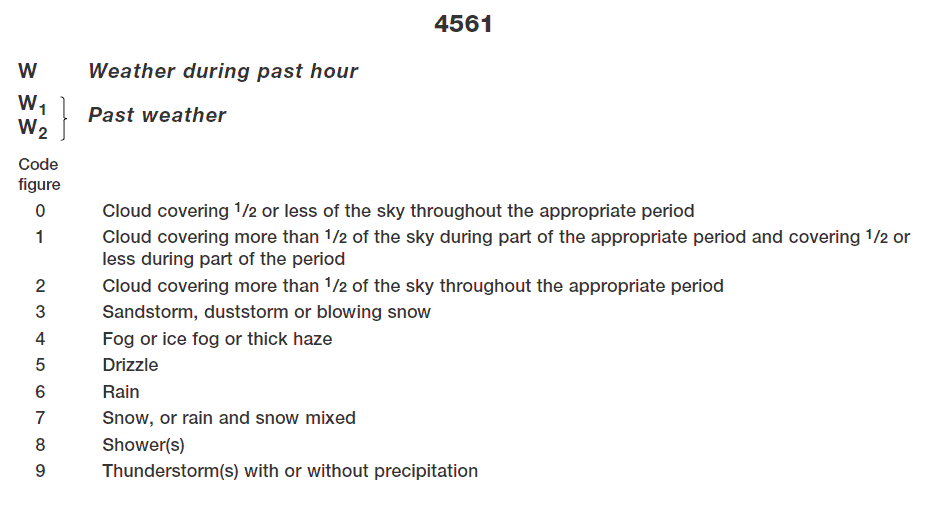
ww
W
1W2
w
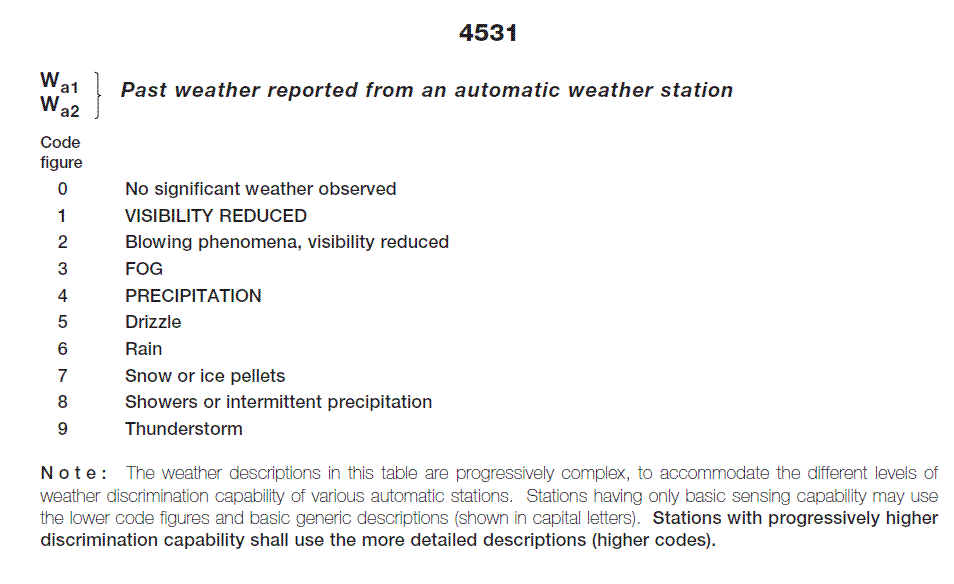
awa
W
a1Wa2
N
h
C
H
C
M
C
L
GGgg
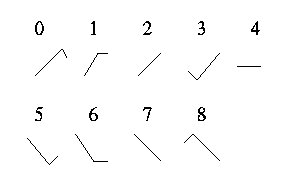
D
s
Code
figure
1 NE
2 E
3 SE
4 S
5 SW
6 W
7 NW
8 N
9 Unknown
/ Report from a coastal land station or displacement
  of
ship not reported
v
s
Code
figure knot km/h
0 0 0
1 1-5 1-10
2 6-10 11-19
3 11-15 20-28
4 16-20 29-37
5 21-25 38-47
6 26-30 48-56
7 31-35 57-65
8 36-40 66-75
9 Over 40 Over 75
/ Not applicable (report from a caostal landstation)
  or
not reported.
s
sindicator for sign and type of measurement of sea-surface
temperature
Code
figure Sign Type of measurement
0 Positive or 0 Intake
1 Negative Intake
2 Positive or 0 Bucket
3 Negative Bucket
4 Positive or 0 Hull contact sensor
5 Negative Hull contact sensor
6 Positive or 0 Other
7 Negative Other
T
wTwTwSea-surface temperature, in tenths of a degree
Celsius, its sign being given by ss
P
waPwaPeriod of waves, obtained by instrumental methods,
in seconds
H
waHwaHeight of waves, obtained by instrumental methods,
in units of 0.5 metre
P
wPwPeriod of wind waves, in seconds
H
wHwHeight of wind waves, in units of 0.5 metre
d
w1dw1,
dw2dw2True direction, in tens of degrees, from which
swell waves are coming
Code
figure
00 Calm
01 5-14
02 15-24
03 25-34
etc. etc.
36 335-4
99 Variable, or all directions or unknown or waves
confused, direction indetermininate
P
w1Pw1
Pw2Pw2Period of swell waves, in seconds
H
w1Hw1
Hw2Hw2Height of swell waves, in the same units as HwHw
I
sIce accretion on ships
Code
figure
1 Icing from ocean spray
2 Icing from fog
3 Icing from spray and fog
4 Icing from rain
5 Icing from spray and rain
E
sEsThickness of ice accretion on ships, in centimetres.
R
sIce accretion on ships
Code
figure
0 Ice not building up
1 Ice building up slowly
2 Ice building up rapidly
3 Ice melting or breaking up slowly
4 Ice melting or breaking up rapidly
H
waHwaHwaHeight of waves, obtained by instrumental methods,
in units of 0.1 metre
PwaPwaPwa shall be reported in addition to PwaPwaHwaHwa when the following conditions have been met:
(a) The sea is not calm (i.e. PwaPwaHwaHwahas not been reported as 0000)
(b) HwaHwahas not been reported as //
(c) The station has the capability of accurately
  measuring instrumental wave period in units of 0.1 meter
s
wIndicator for the sign and type of wet-bulb temperature
reported
0 Positive or zero measured wet-bulb temperature
1 Negative measured wet-bulb temperature
2 Iced bulb measured wet-bulb temperature
5 Positive or zero computed wet-bulb temperature
6 Negative computed wet-bulb temperature
7 Iced bulb computed wet-bulb temperature
T
bTbTbWet-bulb temperature, in tenths of a degree Celsius,
its sign being given by sn
c
iConcentration or arrangement of sea ice
figure |
|||
S
iStage of development
figure |
|
b
iIce of land orogin
figure |
|
D
iTrue bearing of principal ice edge
figure |
|
z
iPresent ice situation and trend of conditions over
preceding three hours
figure |
|||