Updated on 16 Feb. 2026
Japan Meteorological Agency
Extremely likely that a trend of rise has been observed since the 1980s along the coast of Japan, although some long-period variability (assumed to be natural variability) is predominant over the whole period.
The average rate of MSL rise using records from 13 tide gauges (based on GPS data to exclude the effects of vertical land motions (VLM)) was 3.4 [1.5 to 5.2] mm per year from 2006 to 2018.
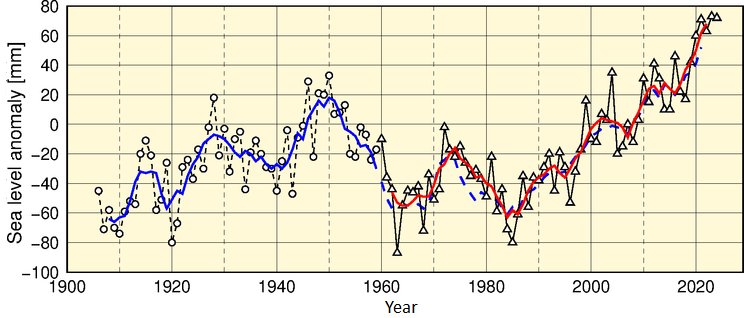
Fig.1 Time-series representation of annual mean sea level around Japan (1906 – 2025)
The blue line represents the five-year running mean of annual MSL anomalies averaged over four stations.
The red line represents the same for 16 stations. The 1991 – 2020 average is used as the normal.
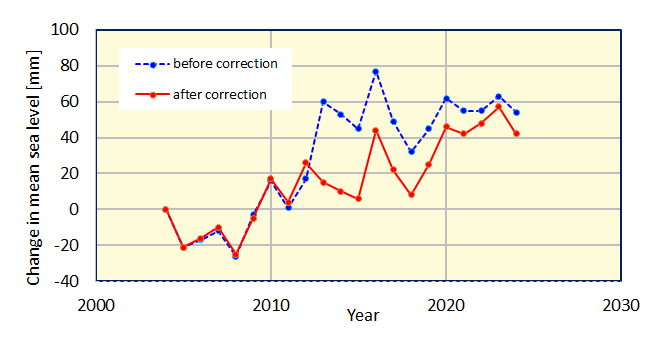
Fig.2 Changes in mean sea level around Japan with the effects of VLM excluded (2004 – 2025)
Changes in MSL average among 13 tide gauges with GPS data.
The blue plots represent changes estimated with tide gauge records before correction, and the red plots represent changes after correction.
MSL in 2004 is taken as 0 mm.
Table1. The average rate of MSL around Japan and global MSL (mm/year)
| Japan(Fig.1) | Japan(Fig.2) | Global(IPCC,2021) | |
|---|---|---|---|
| 2004 – 2025 | 3.7 [2.7 – 4.7] | 3.5 [2.8 – 4.2] | |
| 2006 – 2018 | 2.9 [0.8 – 5.0] | 3.4 [1.5 – 5.2] | 3.7 [3.2 – 4.2] |
MSL in Japanese coastal areas exhibited no significant rise from 1906 to 2025. Variations with 10- to 20-year periods are seen in this time frame, as decadal climate variability has a greater effect than global warming. However, a trend of MSL rise since the 1980s is seen. This is attributed to global mean sea level (GMSL) rise from the effects of global warming (Fig.1).
The annual MSL anomaly around Japan in 2025 is 67 mm higher than the normal (i.e. the 1991 – 2020 average, Fig.1). However, the values in Fig.1 may still include some VLM effects.
Annual MSL is calculated using records from 13 tide gauges with GPS data to exclude the effects of VLM. The 2025 MSL value was 65 mm higher than that of 2004 (Fig.2).
Chapter 9 of the IPCC 6th Assessment Report(AR6) concluded that GMSL rise in the 20th century had been faster than in any prior century over the last millennium, with acceleration since the late 1960s. The average rate of GMSL rise was 3.7 [3.2 to 4.2] mm per year from 2006 to 2018 (high confidence). The rate of MSL rise around Japan with the effects of VLM excluded was 3.4 [1.5 to 5.2] mm per year in the same period. These figures are comparable to those observed for GMSL in recent years.
The values in square brackets show the 90% uncertainty range.