Updated on 1 Dec. 2025
Japan Meteorological Agency
Surface seawater pH values have shown a clear long-term trend of decrease in vast areas of the global ocean. The rate of decrease is approximately 0.018 pH per decade (1990–2024).
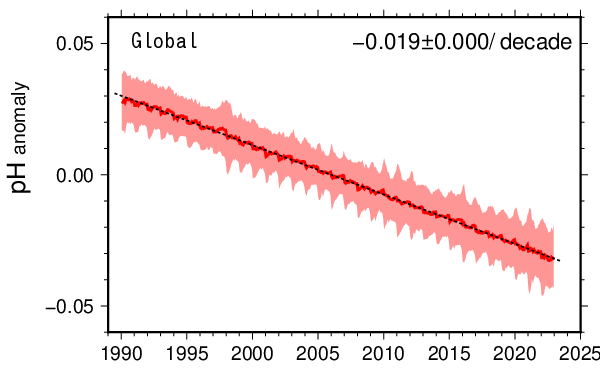

Long-term trend of surface seawater pH (left) and pH distribution in 2024 (right) in the global ocean
Left: Rate of pH change in the global ocean. The solid line is a time-series representation of the pH anomaly from the normal (average from 1991 to 2020) in the global ocean. The shaded area and dotted line represent the standard deviation range (±1σ) and the long-term trend, respectively. The '±' symbol indicates a 95% confidence interval.
Right: Lower pH values are represented as warmer colors.
Oceans today are slightly alkaline with a surface pH of around 8.1. However, a long-term trend of pH decrease (known as ocean acidification) is observed due largely to the dissolution of atmospheric carbon dioxide (CO2) in ocean water. As the concentration of atmospheric CO2 is steadily increasing, there are concerns that oceans may be more acidified in the future.
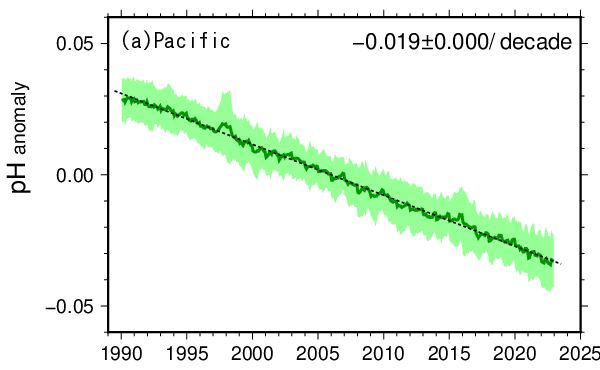
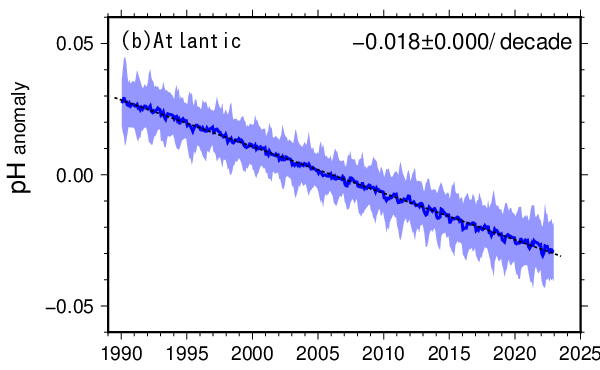
To monitor the long-term variability of ocean acidification, the Japan Meteorological Agency (JMA) has analyzed monthly sea surface pH values after 1990 based on a global oceanographic observation database. The results show a clear trend of in-situ pH decrease in the global ocean. The rates of decrease are 0.019, 0.017 and 0.019 pH per decade in the Pacific, the Atlantic and the Indian Ocean, respectively.
The pH in surface seawater varies by area due to differences in ocean circulation, biological activity and seasonal change. In the equatorial area, upwelling CO2-rich seawater causes relatively low pH values. Subtropical (subpolar) areas show higher pH values than equatorial areas with seasonal changes of higher (lower) pH in winter and lower (higher) pH in summer. (pH distribution maps)
 |
 |
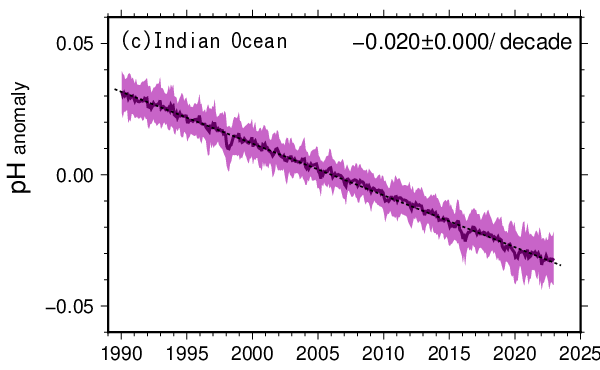 |
Long-term trends of the surface seawater pH values in the Pacific (a), the Atlantic (b) and the Indian Ocean (c)
(a)–(c) The figures indicate rates of change in each area. The solid line, shaded area and dotted line are time-series representations of average pH values, the standard deviation range (±1σ) and the long-term trend, respectively. The '±' symbol indicates a 95% confidence interval.