Background data for greenhouse gas and reactive gas observation
Purpose of background data selection
Large variations in greenhouse gas concentrations may be observed even within a matter of hours due to local changes considered to be associated with anthropogenic or vegetation activity within the surface boundary layer under certain weather conditions. Data without such local variations need to be selected to obtain atmospheric background information representing average values for a horizontally wide space within the surface boundary layer.
An air mass affected by local variations is assumed to undergo larger temporal changes due to its smaller spatial scale. As many data as possible should ideally be selected with locally affected examples removed to give highly reliable background data.
JMA selects background data on greenhouse gases and reactive gas observations and calculates mean values.
Observation and selection in 2009 (carbon dioxide)
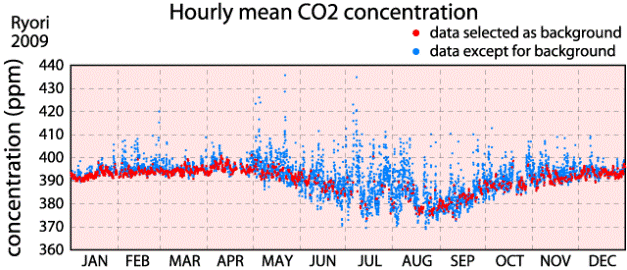
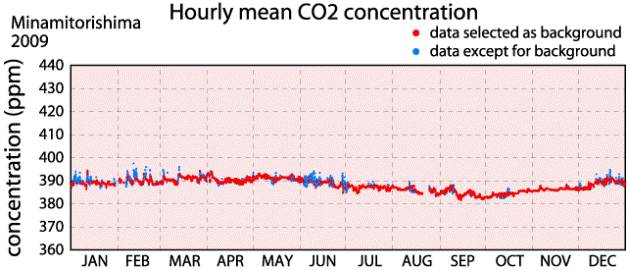
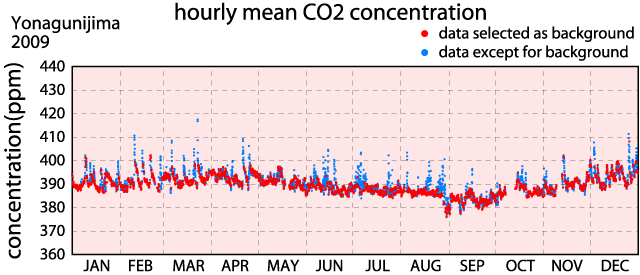
The observations and the selected background data for 2009 are shown in Figure 1-3 based on the example of carbon dioxide results.
Background data relating to all hourly mean values for Ryori, Minamitorishima and Yonagunijima are shown in red, and others are shown in blue. The ratios of the selected background data in 2009 were 40, 77 and 68% in Ryori, Minamitorishima and Yonagunijima, respectively. The lower selection rate for Ryori in summer is thought to be due to enhanced photosynthesis of vegetation around the site.
|
Figure 1: Time-series representation of hourly mean atmospheric CO2 concentrations at Ryori in 2009 |
|
Figure 2: Time-series representation of hourly mean atmospheric CO2 concentrations at Minamitorishima in 2009 |
|
Figure 3: Time-series representation of hourly mean atmospheric CO2 concentrations at Yonagunijima in 2009 |
Related information
The methods for background data selection and mean calculation depend on the greenhouse gas species. See individual observation pages for details.


