Atmospheric halocarbon observation
Halocarbons are carbon compounds containing fluorine, chlorine, bromine and iodine, which are halogens. Most halocarbons are produced industrially rather than existing originally in nature.
Chlorofluorocarbons (CFCs), which are compounds of carbon, fluorine and chlorine, are major halocarbons. They act as greenhouse gases in the atmosphere, and some of them destroy stratospheric ozone. At JMA's Ryori observation station, atmospheric concentrations of CFC-11 (CCl3F), CFC-12 (CCl2F2) and CFC-113 (CCl2FCClF2) are observed. Other halocarbons such as 1,1,1-trichloroethane (CH3CCl3) and carbon tetrachloride (CCl4) are also observed at the station.
Hydrofluorocarbons (HFCs; carbon compounds containing fluorine and hydrogen) do not cause stratospheric ozone depletion, but do act as greenhouse gases in the atmosphere.
Atmospheric concentrations of
HFC-23 (CHF3), HFC-32 (CH2F2), HFC-125 (CHF2CF3), HFC-143a (CH3CF3), HFC-134a (CF3CH2F), HFC-152a (CH3CHF2), HFC-227ea (CF3CHFCF3), and HFC-245fa (CHF2CH2CF3) are monitored at JMA's Minamitorishima Station.
Atmospheric chlorofluorocarbons observation
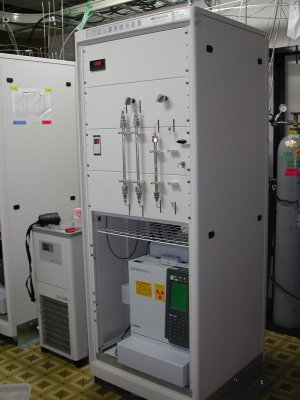
Analyzer
Atmospheric chlorofluorocarbon (CFC) concentrations are observed using a gas chromatograph (GC) equipped with a radiative electron capture detector (ECD) . The GC-2014 system model (Shimadzu Corporation; Figure 1) is used for this purpose at Ryori.
|
Figure 1: CFCs observation system at Ryori |
Air sample collection and analysis
Air samples are continuously fed into the observation area from an intake at a height of about 7 m above ground level. The observation system feeds an air sample into a 10-mL sample tube once every hour and sends it into the analyzer. Due to the very low concentrations of the atmospheric CFC observed (i.e., CFC-11, CFC-12 and CFC-113), the compositions in the air samples are first adsorbed by a low-temperature trap agent (5 cm of Res-SilTMC and 5 cm of Porapak TMT) before being heated rapidly and introduced to a column (3 m of Res-SilTMC) that separates the target compositions. A set of three standard gases is measured every eight hours. It takes 40 minutes to measure the concentration of each gas, or two hours in total for all three gases.
Determination of concentration
The air sample outputs are converted into concentration values at Ryori observation station using a quadratic calibration curve determined for each measurement cycle based on the known concentrations of the standard gases and the corresponding outputs. Three standard gases with different concentrations are prepared to the order of atmospheric concentrations using the gravimetric method. To minimize errors caused by temporal variations in the response of the analyzer, two concentrations are calculated from calibration curves before and after air sample measurement. These two values are then time-interpolated to determine hourly concentrations.
A target gas with concentrations matching those of ambient air is measured regularly for each calibration curve to monitor long-term variations in the standard gases as well as any possible anomalies in the observation system.
Background data selection and statistics
The selection procedure for background data in CFC observation is the same as that for other observation species, and mean values are calculated. The selection procedure for background data is as follows:
- Daily mean values are calculated from hourly mean values, excluding those observed during inspections, periods of system malfunction and other such situations.
- Daily mean values based on fewer than three hourly mean values are rejected.
- Daily mean values are rejected when the standard deviation of the hourly mean values on which calculation is based exceeds a prescribed threshold.
- Daily mean values remaining after the above steps are regarded as background data.
- Monthly mean values are taken as the mean of daily mean values selected as background data.
- Annual mean values are the yearly averages of monthly mean values.
The thresholds detailed above are set as 10, 20 and 7 ppt for CFC-11, CFC-12 and CFC-113, respectively, based on past observation data to exclude concentration data affected by local factors while utilizing as many background data as possible.
Atmospheric 1,1,1-trichloroethane and carbon tetrachloride observation
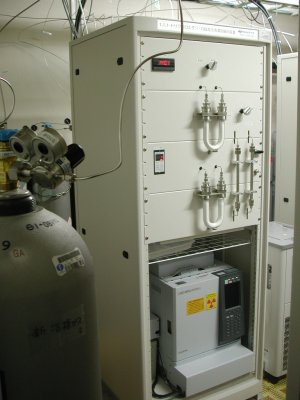
Analyzer
Atmospheric 1,1,1-trichloroethane (CH3CCl3) and carbon tetrachloride (CCl4) are observed using a gas chromatograph (GC) equipped with a radiative electron capture detector (ECD) . The GC-2014 system model (Shimadzu Corporation; Figure 2) is used for this purpose at Ryori.
|
Figure 2: 1,1,1-trichloroethane and carbon tetrachloride observation system at Ryori |
Air sample collection and analysis
Air samples are continuously fed into the observation area from the same intake used for CFC observation at a height of about 7 m above ground level. The observation system feeds an air sample into a 150-mL sample tube once every hour and sends it to the analyzer. Due to the very low concentrations of the atmospheric CH3CCl3 and CCl4 observed, the compositions in the air samples are first adsorbed by a low-temperature trap agent (20 cm of PorapakTM P 50/80 mesh) before being heated rapidly and introduced to a column (Silicon DC-200 20% and 2 m of Chromosorb®W/AW-DMCS 60/80 mesh) that separates the target compositions. A set of three standard gases is measured every eight hours. It takes 40 minutes to measure the concentration of each gas, or two hours in total for all three gases.
Determination of concentration
The air sample outputs are converted into concentration values at Ryori observation station using a quadratic calibration curve determined for each measurement cycle based on the known concentrations of the standard gases and the corresponding outputs. Three standard gases with different concentrations are prepared to the order of atmospheric concentrations using the gravimetric method. To minimize errors caused by temporal variations in the response of the analyzer, two concentrations are calculated from calibration curves before and after air sample measurement. These two values are then time-interpolated to determine concentration for every hour.
A target gas with concentrations matching that of ambient air is measured regularly for each calibration curve to monitor long-term variations in the standard gases as well as any possible anomalies in the observation system.
Background data selection and statistics
The selection procedure for background data is the same as that for atmospheric CFCs. The threshold for CH3CCl3 and CCl4 is 10 ppt.
Atmospheric hydrofluorocarbon observation
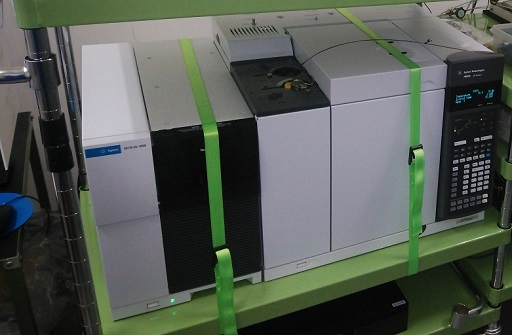
Analyzer
Atmospheric hydrofluorocarbon (HFC) concentrations are observed using a gas chromatograph along with a mass spectrometer (GC-MS). The GCMS-5977 system model (Agilent Technologies Inc.; Figure 3) is used for this purpose at Minamitorishima.
|
|
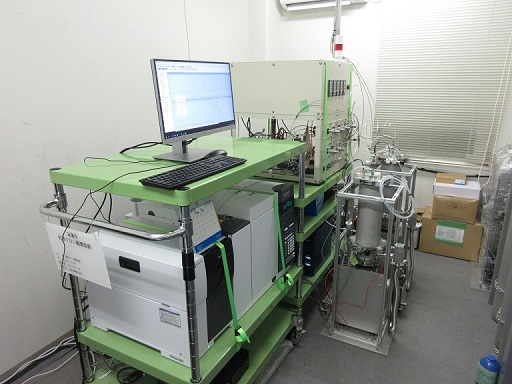
|
Figure 3: HFC observation system at Minamitorishima (top) and gas chromatograph/mass spectrometer (bottom) |
Air sample collection and analysis
Air samples are continuously fed into the observation area from an intake at a height of about 20 m above ground level. Due to the very low concentrations of atmospheric HFCs observed, the samples are first adsorbed to a trap at low temperature before being heated rapidly and injected into a gas chromatograph/mass spectrometer(GC-MS). A standard gas sample is observed every eight hours. Determination of concentration takes an hour for each gas.
Determination of concentration
Concentration values are extracted from air sample outputs at Minamitorishima Station via linear regression for each monitoring cycle based on known standard-gas concentrations gas and corresponding output. Working standard gases are calibrated against gravimetrically formulated standards, and concentrations calculated before and after monitoring are compared to minimize errors from temporal variations in analyzer response. The two values are time-interpolated to determine hourly concentrations.
A target gas with concentrations matching those of ambient air is monitored regularly to determine long-term variations in standard gases and potential observation system anomalies.
Background data selection and statistics
The selection procedure for background data is the same as that for atmospheric CFCs. The thresholds for HFCs are
HFC-23: 1.2 ppt; HFC-32: 1.8 ppt, HFC-125: 1.1 ppt; HFC-143a: 0.7 ppt;
HFC-134a: 3.0 ppt; HFC-152a: 0.7 ppt; HFC-227ea: 0.1 ppt; HFC-245fa: 0.1 ppt.