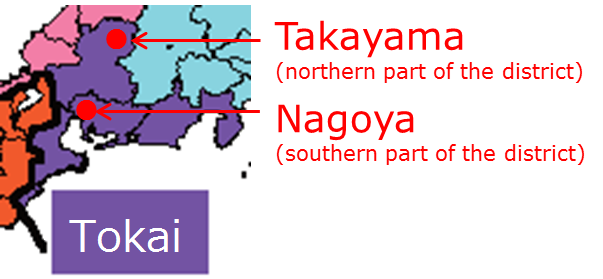
Figure 1 Location of Takayama City and Nagoya City
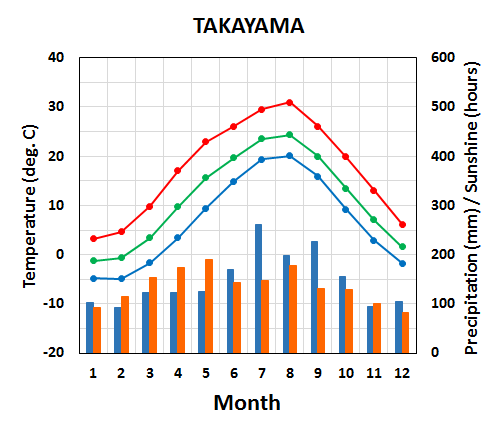
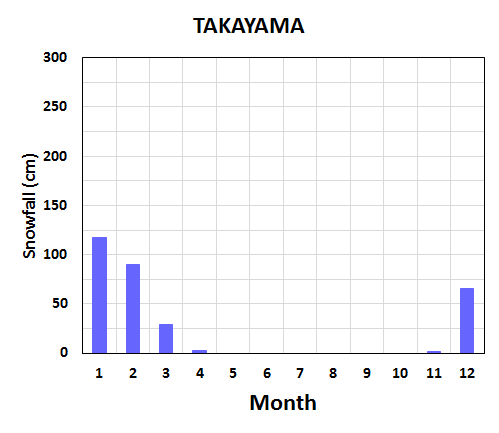
Figure 2 Seasonal variation of meteorological elements in Takayama City
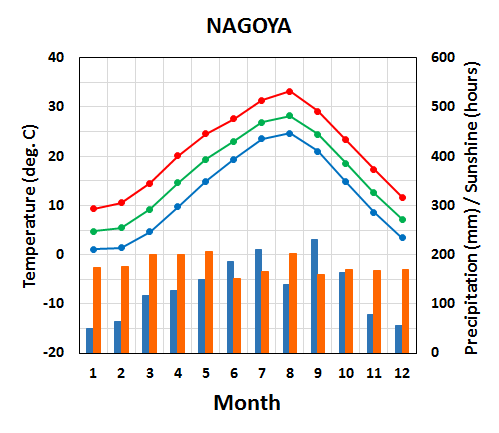
Figure 3 Seasonal variation of meteorological elements in Nagoya City Winter (December-January-February)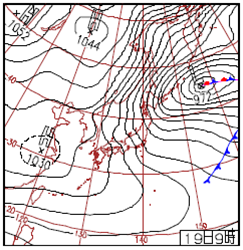
Figure 4 Weather chart for 00UTC on 19 December 2005 In winter (December-January-February), the Siberian High develops over the Eurasian Continent and the Aleutian Low develops over the northern North Pacific. Prevailing northwesterly winds cause the advection of cold air from Siberia to Tokai, bringing heavy snowfall to northern parts (inland areas) and sunny weather to southern parts (downstream of mountainous areas). However, cold air sometimes flows through the ravine from the Sea of Japan side of Kinki to southern Tokai, bringing heavy snowfall to parts of the southern Tokai area. Spring (March-April-May)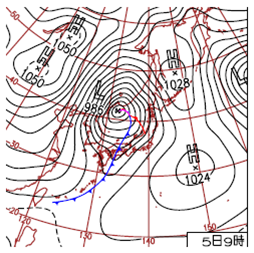
Figure 5 Weather chart for 00UTC on 5 March 2007 In spring (March-April-May), migratory cyclones and anticyclones that alternately move eastward prevail across Japan. Temperature increases (decreases) in front (back) of cyclonic systems due to warm southerly (cold northerly) flow. Temperature in Tokai rises gradually with large short-term variations. The sunshine duration is long in the second half of spring due to the predominance of anticyclonic systems. Summer (June-July-August)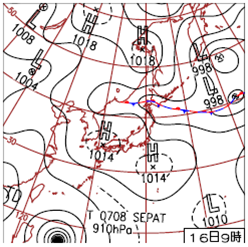
Figure 6 Weather chart for 00UTC on 16 August 2007 The period from early June to the middle of July is the rainy season (known as the Baiu). Its precipitation is caused by a stationary front, called the Baiu front, which forms where a warm maritime tropical air mass meets a cool polar maritime air mass. In the second half of summer, the North Pacific High extends northwestward around Japan, bringing hot, humid, and sunny conditions to Tokai. Autumn (September-October-November)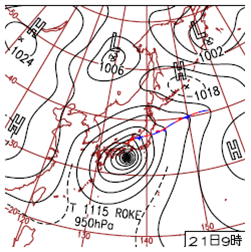
Figure 7 Weather chart for 00UTC on 21 September 2011 In autumn (September-October-November), temperatures in Tokai fall gradually. Monthly precipitation amounts over Tokai are large in September due to the active autumnal rain front and tropical cyclones. In October, the frequent passage of anticyclonic systems brings sunny conditions and refreshing air to Tokai. The frequency of cold northwesterly flows across Japan and snowfall in the northern part of Tokai show an increasing tendency in November. |