The Global CO2 Distribution product provides information on global CO2 mole fractions based on the results of numerical simulation using observation data from various sites worldwide. It demonstrates temporal and spatial variations in CO2 mole fractions from various perspectives. Grid point data (NetCDF format) can be downloaded from this Global CO2 Distribution page.
|
Spherical projection representing global distribution of surface, upper-air and column-average CO2 mole fractions (monthly mean / annual mean ) |
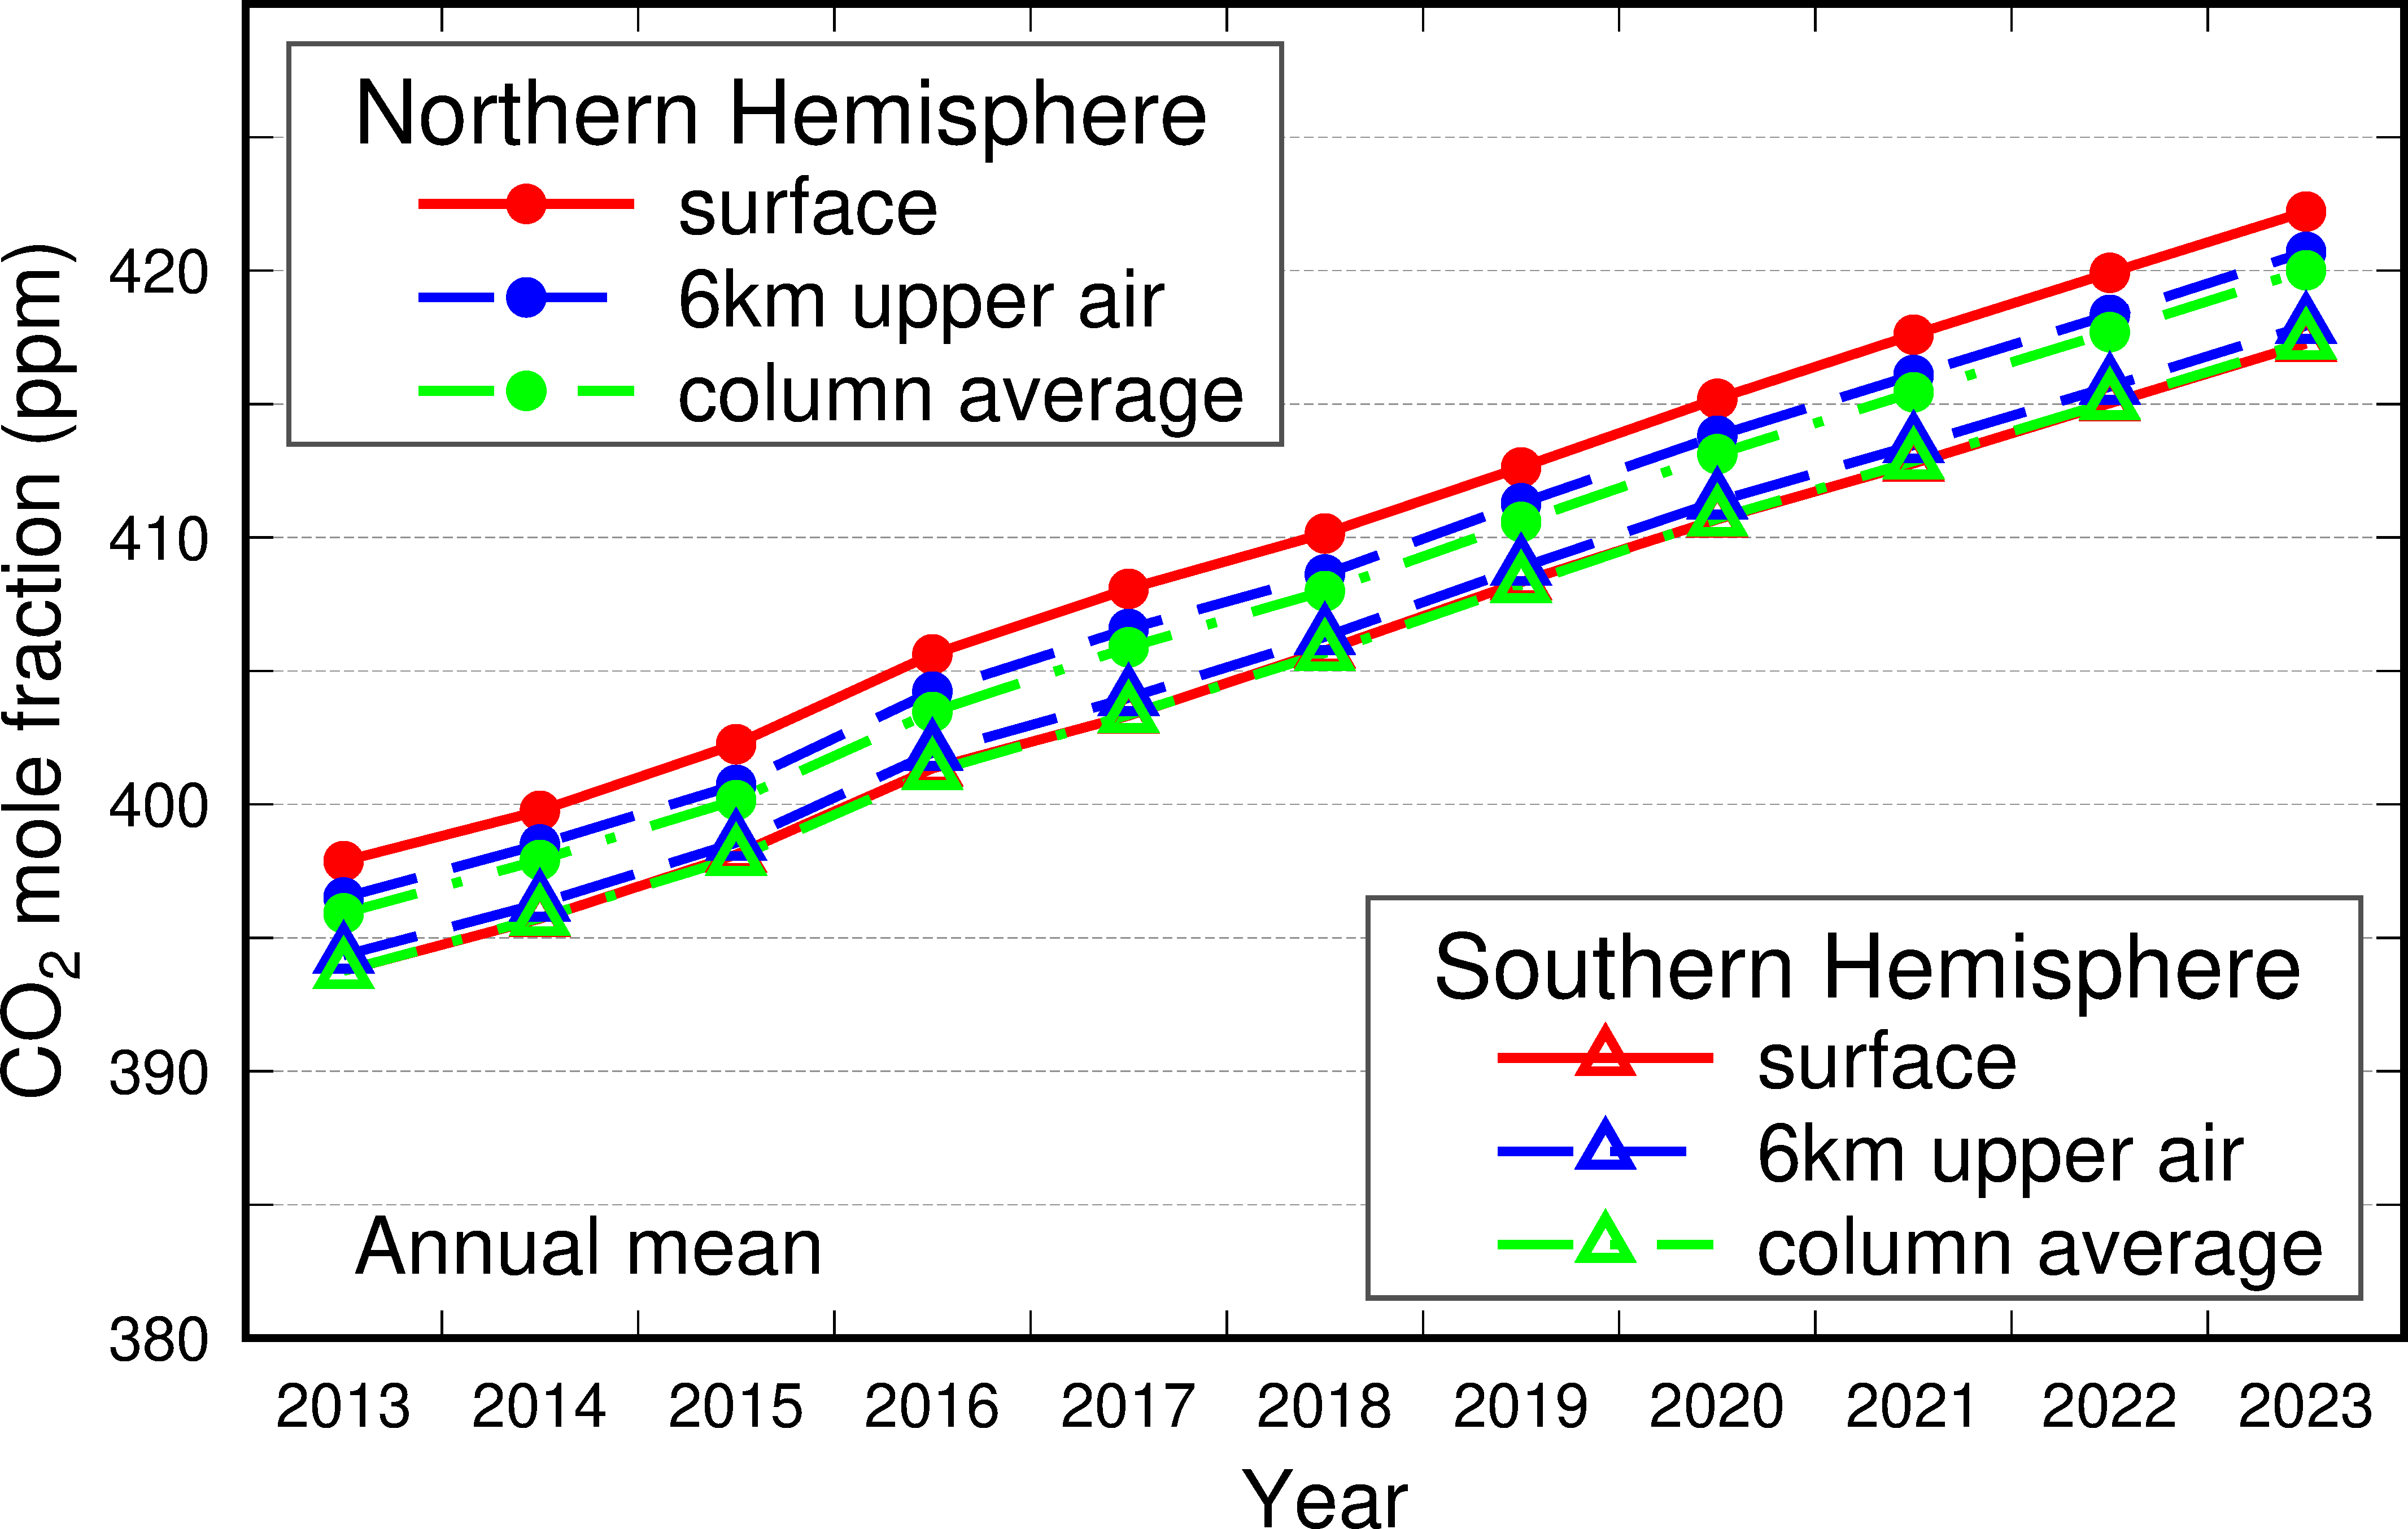
Temporal variations in surface, upper-air and column-average CO2 mole fractions for simulation data grid points |
|
Planar world map representing global distribution of surface, upper-air and column-average CO2 mole fractions (monthly mean / annual mean ) |
Planar world map representing global distribution of surface, upper-air and column-average CO2 growth rates (annual increments) |
|
Outline of the method used to numerically estimate global distribution of CO2 mole fractions |
List of observation sites contributing analysis data |
 Commentary
Outline of surface/upper-air/column-average CO2 mole fraction characteristics based on simple data analysis |
Numerical data used for the above web content |