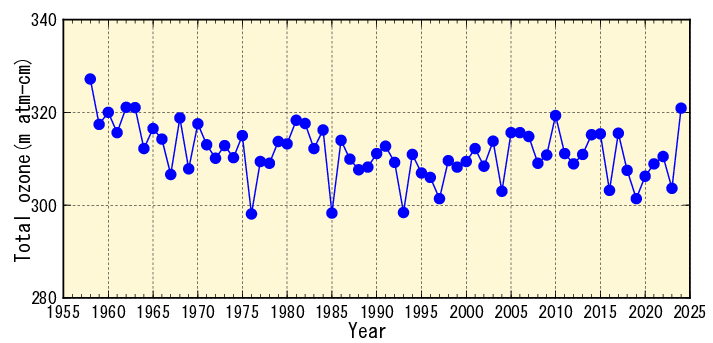
Figure 1 shows decreasing annual-mean total ozone at Tsukuba from the 1980s until the early 1990s, and then a slight increase until the early 2000s. Recent years have shown interannual variability, but no discernible trend.
Figure 1: Time-series of annual-mean total ozone at Tsukuba (36.06°N, 140.13°E)