Observation station for greenhouse gases (Ryori)
In Ryori, the Japan Meteorological Agency (JMA) observe the atmosphere density of greenhouse gases at the part of the Global Atmosphere Watch (GAW) programme of the World Meteorological Organization (WMO). Please refer to "Observation stations for greenhouse gases" for the observation of the JMA in the GAW programme.
Ryori (RYO)
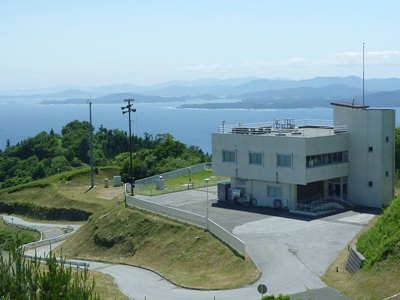
Ryori Station is located on a hilly cape on the Pacific coast of the Tohoku Region (see Figure 1). The station is situated about 10 km east-southeast of the central part of Ofunato City, and about 120 km from Sendai City, the largest city in the region. Being isolated from populated areas, the area surrounding the station is not significantly affected by local sources of pollution, and thus satisfies the conditions required for a GAW Regional Station. In April 2002, the station was moved about 270 m northeastward from its original site, resulting in a change of its altitude from 230 m to 260 m, and the altitude of its air inlet from 260 m to 272 m. Table 1 lists the observation parameters and systems used at Ryori Station.
|
Figure 1: Location of Ryori station |
|
Figure 2: Bird's eye view of Ryori |
|
Table 1: Observation parameters, frequency and instruments at Ryori |
| Parameter | Observation start | Frequency | Instruments |
|---|---|---|---|
| CO2 | Jan. 1987 | Continuous |
Non-dispersive Infrared Analyzer (NDIR)
HORIBA, Ltd. VIA500R(Jan. 1987 - Dec. 2003) HORIBA, Ltd. VIA510R(Jan. 2004 - Dec.2008) LI-COR Biosciences, Inc. LI-7000(Jan. 2009 -) |
| CH4 | Jan. 1991 | Continuous |
Non-dispersive Infrared Analyzer (NDIR)
HORIBA, Ltd. GA360-S(Jan. 1991 - Dec. 2008) Gas Chromatograph with FID Round Science Inc. RCG-1(Jan. 2009 -) |
| CO | Jan. 1991 | Continuous |
Non-dispersive Infrared Analyzer (NDIR)
HORIBA, Ltd. GA360-S(Jan. 1991 - Dec. 2008) Gas Chromatograph with RGD Round Science Inc. TRA-1(Jan. 2009 -) |
| O3 | Jan. 1990 | Continuous |
UV Ozone Monitor
EBARA JITSUGYO CO.,LTD. EG-2001F(Jan. 1990 - Dec. 2004) EBARA JITSUGYO CO.,LTD. EG-2001FTP(Jan. 2005 - Dec. 2008) Thermo Fisher Scientific Inc. 49i(Jan. 2009 -) |
| CFCs | Jan. 1990 | Once per hour |
Gas Chromatograph with ECD
Yanaco Ohgi CO., Ltd. AG-1000EN(Jan. 1990 - Aug. 2003) Shimadzu Corporation GC-14B(Sep. 2003 - Jan. 2008) Shimadzu Corporation GC-2014 (Feb. 2008 -) |
| N2O | Jan. 1990 | Once per hour |
Gas Chromatograph with ECD
Yanaco Ohgi CO.,Ltd. AG-1000EN(Jan. 1990 - Feb. 2004) Shimadzu Corporation GC-14B(Mar. 2004 - Jan. 2008) Shimadzu Corporation GC-2014(Feb. 2008 -) |
|
CH3CCl3
CCl4 |
Jan. 1991 | Once per hour |
Gas Chromatograph with ECD
Yanaco Ohgi CO.,Ltd. AG-1000EN(Jan. 1991 - Feb. 2005) Shimadzu Corporation GC-14B(Mar. 2005 - Jan. 2008) Shimadzu Corporation GC-2014(Feb. 2008 -) |
| Atmospheric deposition (Terminated in Dec. 2011) |
Jan. 1976 |
Once per
day (precipitation) month (dry deposition) |
Automatic Sampler
Ogasawara Keiki Seisakusho CO.,LTD. |
| Aerosol optical depth (Terminated in Mar. 2018) |
Jan. 1988 | 3 times per day |
Sunphotometer
EKO INSTRUMENTS CO.,LTD. MS-110(Jan. 1988 - Dec. 2005) PMOD/WRC Precision Filter Radiometer(Jan. 2006 - Mar. 2007) |
| Continuous |
Sunphotometer
PMOD/WRC Precision Filter Radiometer(Apr. 2007 - Mar. 2018) |
||
| Aerosol vertical profile (Terminated in Dec. 2011) |
Mar. 2002 | 4 times per day |
Lidar
NEC Corporation |
Climate
Ryori is on the Pacific side of the Tohoku district. The annual mean temperature in a normal year (1987-2010) is 10.5 °C. In January and February, it is chilly, the monthly mean temperatures in a normal year are about 0 °C. The mean temperature of August in a normal year is about 22 °C. From June to September in particular have much precipitation, and the snowfall between the winter season is quantity fewer than an inland. The annual precipitation in a normal year is about 1,450mm.
|
Figure 3: Monthly normal temperature and precipitation at Ryori |
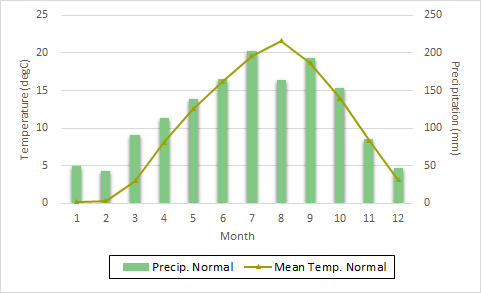
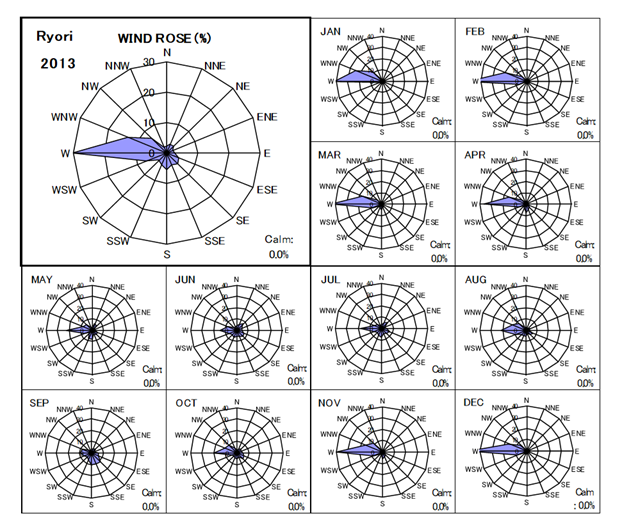
Figure 4 indicates wind rose of annual / monthly mean wind velocity at Ryori in 2013. Wind direction is dominant between west and west-northwest, annual mean wind speed was 4.2 m/s.
|
Figure 4: Wind rose of annual / monthly mean wind velocity at Ryori in 2013 |
References
Information of another observation station for greenhouse gases