Surface ozone observation
Analyzer
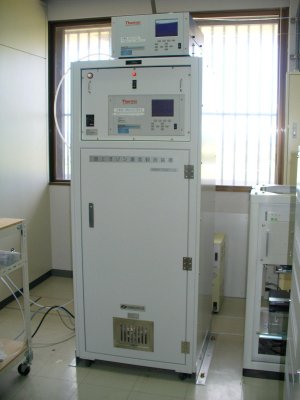
Surface ozone concentrations are observed using an ultra violet (UV) light absorption ozone monitor leveraging UV radiation's characteristic of being absorbed by ozone. The 49i system model (Thermo Fisher Scientific Inc.; Figure 1) is used at JMA observation stations in Japan.
|
Figure 1: Surface ozone observation system at Yonagunijima |
Air sample collection and analysis
Air samples are fed to the observation system from a dedicated intake located on the roof of the observation station (ground heights: 8 m at Ryori and Minamitorishima, 10 m at Yonagunijima, 4m at Syowa Station) at a rate of 10 L per minute, and are partially diverted to the ozone monitor at a rate of 1.5 L per minute. The intake and all piping systems are coated with Teflon®, which does not readily cause ozone deterioration. Air samples are analyzed every 10 seconds at Ryori, Minamitorishima and Yonagunijima and every 12 seconds at Showa Station.
Determination of concentration
Ozone monitors are calibrated accurately using an ozone generator at JMA Headquarters (see Calibration for surface ozone observation ) . Accordingly, ozone monitor outputs can be converted directly into concentration values. The observed concentrations can be corrected by comparing the outputs before and after use to precisely determine the drift of the ozone monitor during use.
The two ozone generators used by JMA for calibration are themselves calibrated against the WMO standard reference photometer maintained by NIST, which allows the direct comparison of concentration data collected at stations with those from locations in other countries where the system maintains traceability to the WMO standard scale.
After around six months of use for observation at stations, ozone monitors are sent back to JMA Headquarters for recalibration. At stations, two ozone monitors are operated in parallel for about a month when the ozone monitor is replaced.
Background data selection and statistics
The analyzed ozone concentrations are quality controlled and statistically processed at JMA Headquarters. Hourly mean values for all observations excluding those made during inspections, periods of system malfunction and other such situations are calculated. Daily and monthly mean values are produced from the hourly mean values when more than half the values are available during the period.
Observations for surface ozone may contain local variations within the surface boundary layer. However, as concentrations of ozone in the atmosphere naturally vary from moment to moment as a result of photochemical formation and destruction, or destruction upon contact with the ground surface, background data are not selected for the calculation of daily and monthly mean values.