Himawari-9 HSD Co-registration Time Series Analysis
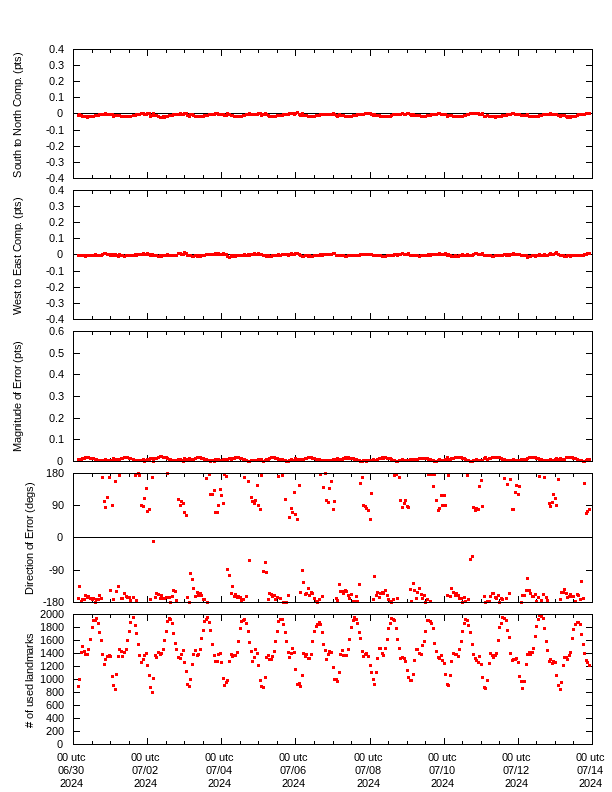
This page displays temporal trends of Himawari-9 HSD co-registration errors. The overall averages of error correction vectors are plotted, with each point corresponding to a single image. The vectors are decomposed into a north-south component (top: positive for imagery shifted northward), an east-west component (second chart: positive for imagery shifted westward), magnitude (third chart) and direction (bottom: positive for clockwise rotation from imagery shifted southward). The unit for the top three charts is the single infrared pixel length for Band 13 (2 km spatial resolution at the sub-satellite point), and that for the direction chart is degrees. The last chart shows the number of analyzed vectors determined in co-registration analysis, and is used to compute the related full-disk average.