Updated on 31 Jan. 2024
Japan Meteorological Agency
The growth rates for oceanic and atmospheric CO2 partial pressure (pCO2) are 1.5–2.8 and 1.8–2.1 µatm/year, respectively.
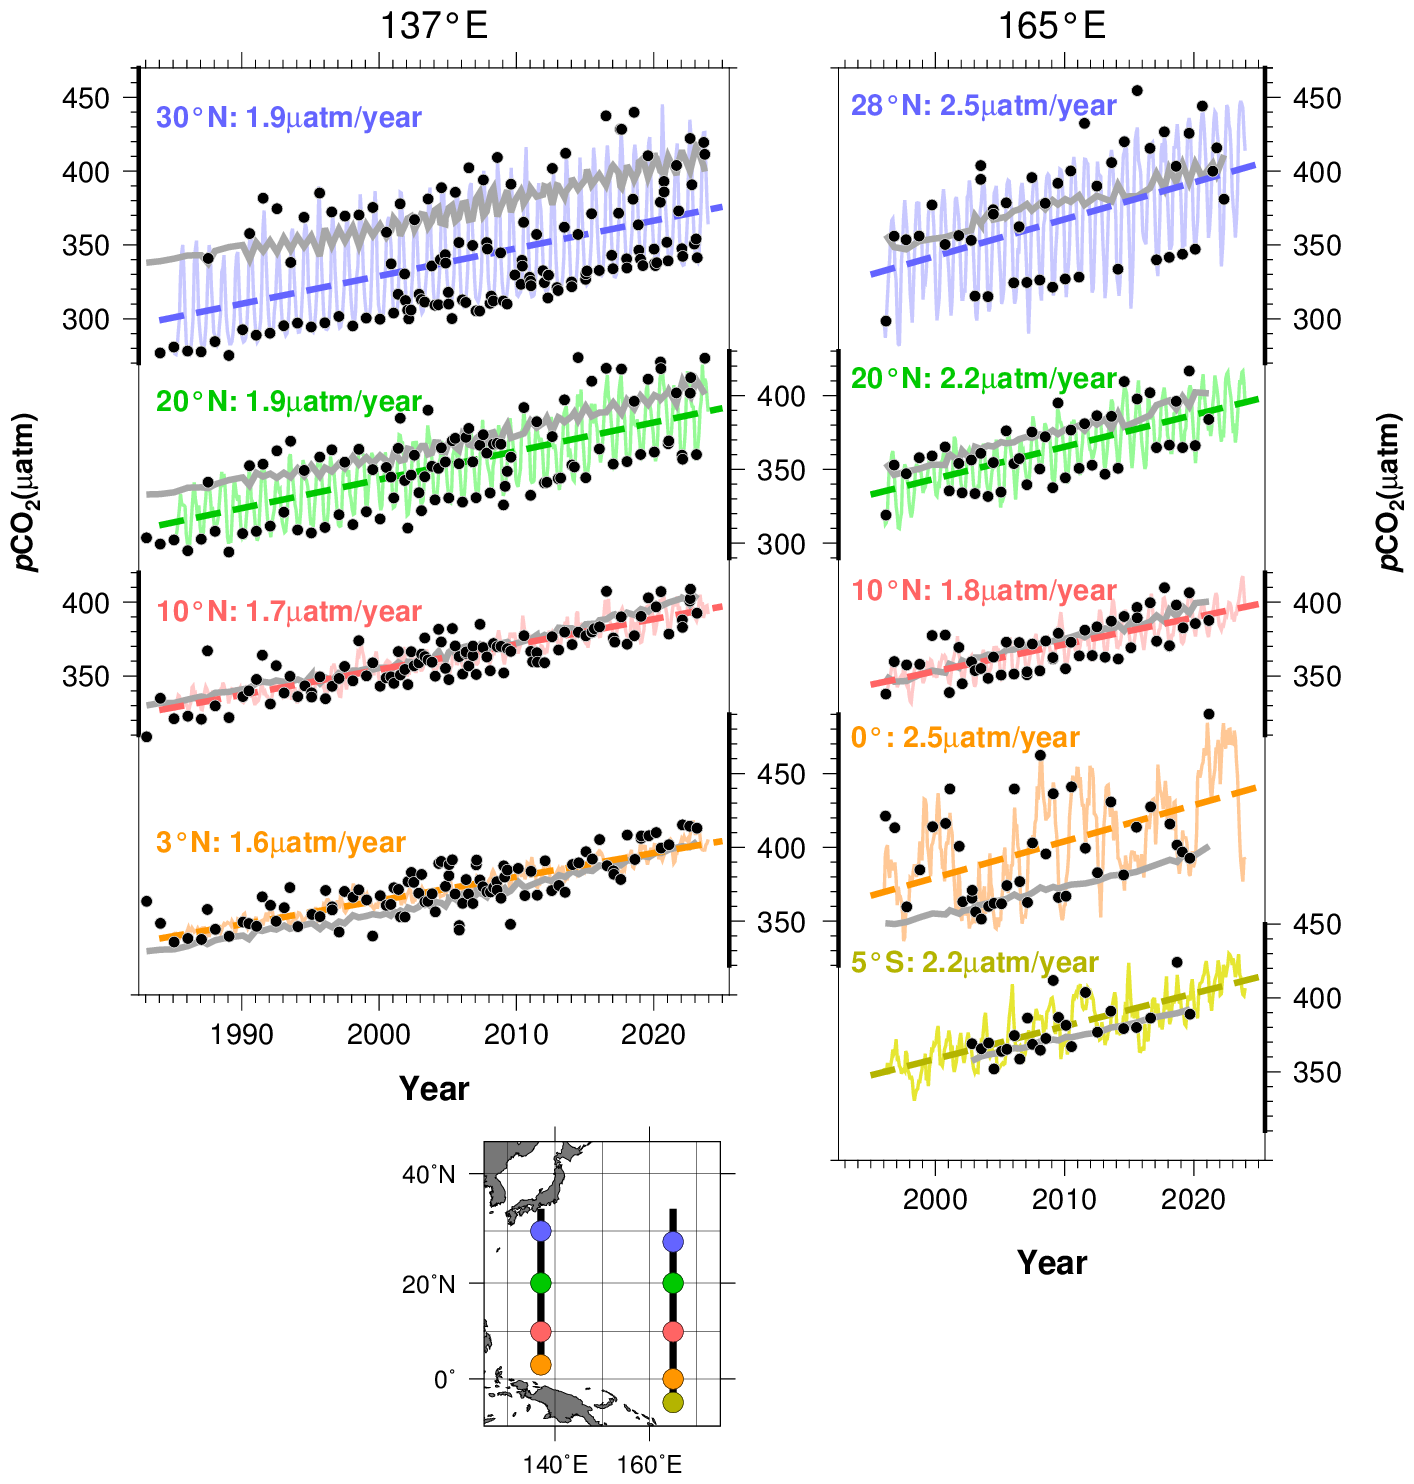
Annual changes in oceanic and atmospheric pCO2 along the 137°E (left) and the 165°E (right) lines.
•Black plots show oceanic pCO2 observation values(text data:137°E
165°E).
•Solid lines represent monthly oceanic pCO2 values reconstructed using the method of Ishii et al. (2011)(text data:137°E
165°E), dashed lines show the long-term trend of oceanic pCO2.
•Gray lines indicate the observed values of atmospheric pCO2(text data:137°E
165°E).
The growth rates for oceanic and atmospheric pCO2 along the line 137°E from 1985 to 2023 were 1.5–2.1 and 1.8–2.0 µatm/year, respectively. Those along the line 165°E from 1996 to 2023 were 1.8–2.8 and 1.9–2.1 µatm/year, respectively. The increase in oceanic pCO2 is associated with a monotonous increase in atmospheric pCO2 caused by anthropogenic emissions, as the ocean absorbs around a third of all CO2 emissions in the atmosphere.
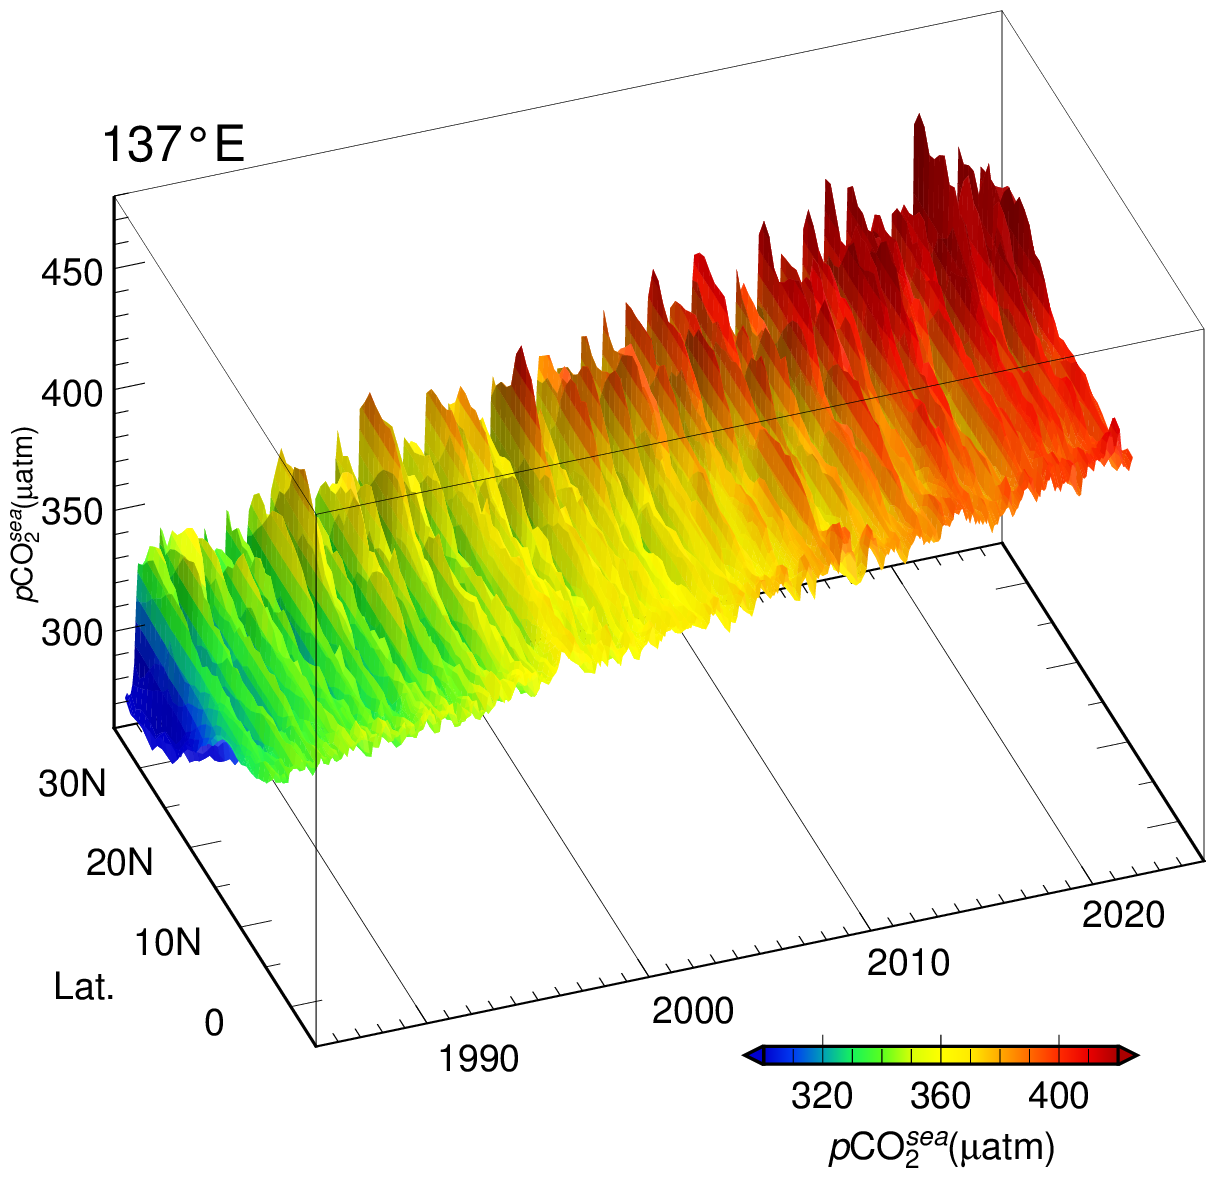
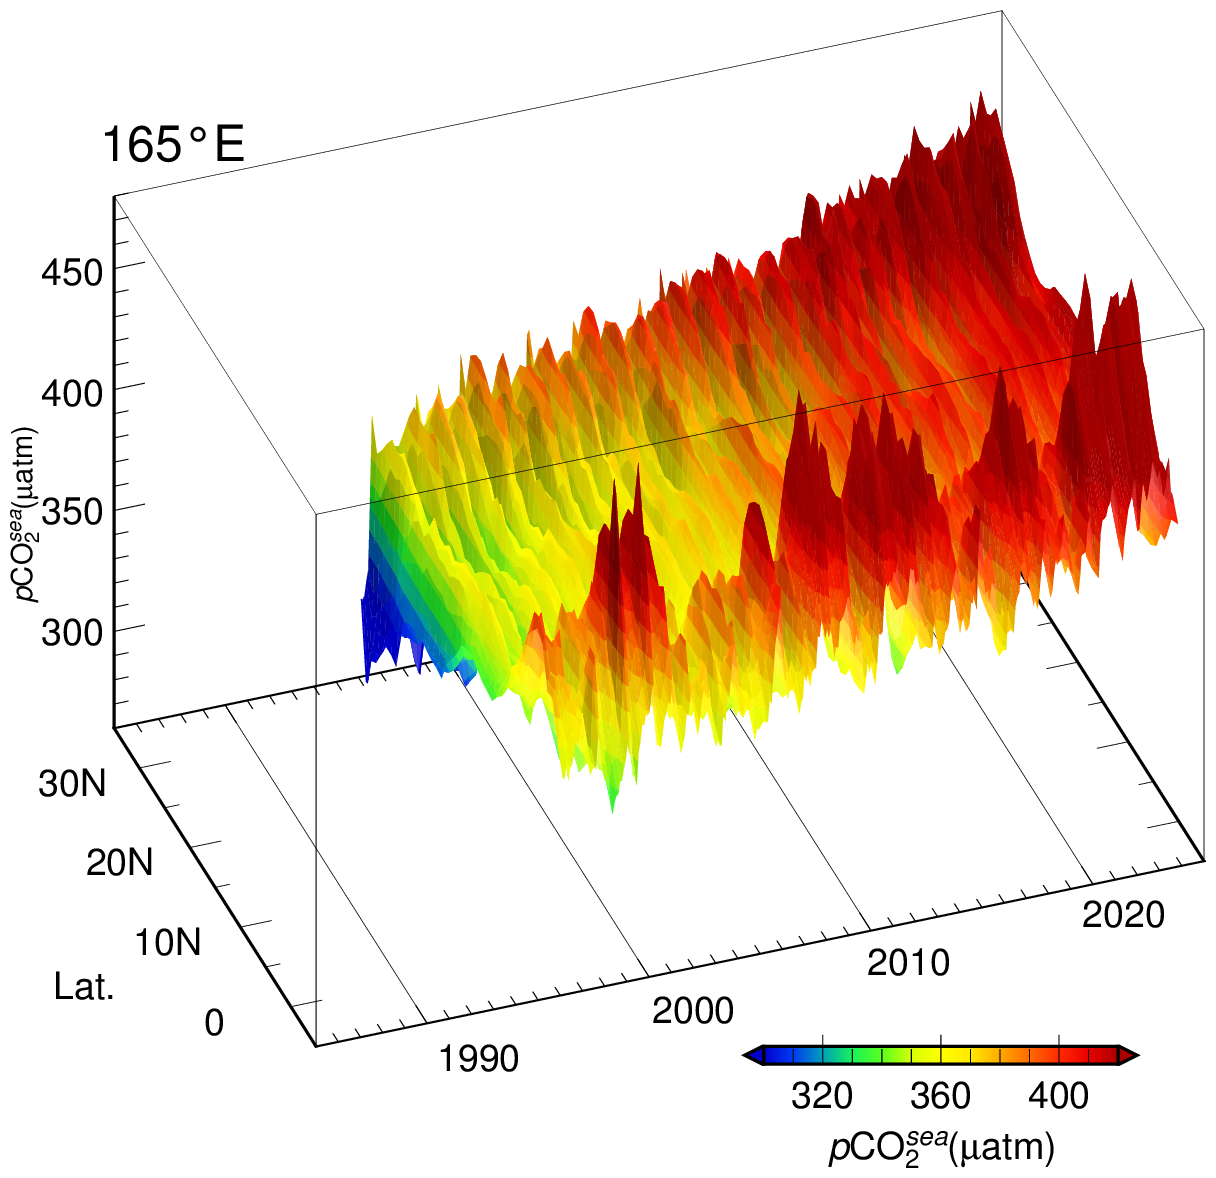
Time-latitude distribution of oceanic pCO2 along the 137°E (left) and the 165°E (right) lines.
Colors indicate reconstructed monthly oceanic pCO2 value. The part on the left shows oceanic pCO2 along the 137°E (3-34°N) since 1985 and the part on the right shows oceanic pCO2 along the 165°E (5°S-35°N) since 1996.